Upgrade from Eikon -> Workspace. Learn about programming differences.

For a deeper look into our Eikon Data API, look into:

Overview |  Quickstart |  Documentation |  Downloads |  Tutorials |  Articles

question

Upvotes
Accepted
6 4 2 6

Eikon API access to historical volume and other financial data

I'm looking to get Volatility and Volume information form the Eikon python API, both real time and historical. I'm having some issues, so first I'll explain what I can do, and then ask the questions:

I've been able to get real-time access to volume and volatility information using the ek.get_data function, and using the following variables:

"TR.Volatility10D", "TR.VOLUME", "CF_VOLUME",

But not with "VOLUME" which does not return data.

When looking for the same information from the past using ek.get_timeseries, I couldn't not find any data using "TR.Volatility10D", "TR.VOLUME" or "CF_VOLUME",

But mysteriously "VOLUME" works to return historical data.

Below is one query I was testing:

prices = ek.get_timeseries(['DIA.N', 'SPY.N'], fields=["TR.Volatility10D", "VOLUME", "TR.VOLUME", "Close"], start_date = "2019-01-18", end_date = "2019-01-25", interval="hour")

Now my questions:

  1. Variable names that work with get_timeseries are different than those that work with get_data - where is this inconsistency documented?
  2. How can I get historical Volatility information using ek.get_timeseries?

Thanks for the help!

-- Jonathan

eikoneikon-data-apipythonrefinitiv-dataplatform-eikonworkspaceworkspace-data-api
icon clock
10 |1500

Up to 2 attachments (including images) can be used with a maximum of 512.0 KiB each and 1.0 MiB total.

Upvotes
Accepted
4.6k 26 7 22

@lansey it is a very good question, but first let me give you a bit of a background of the various data models in the context of getting real-time data and time series.

You have used 4 different fields:

  • TR.Volatility10D
  • TR.VOLUME
  • CF_VOLUME
  • VOLUME

There are three different systems that you get access to with ek.get_data() and ek.get_timeseries(). It is the real-time, reference and time series databases. All of them use RIC (where available) as a primary identifier, however, use different fields. Let me explain the difference

Real-time vs reference data

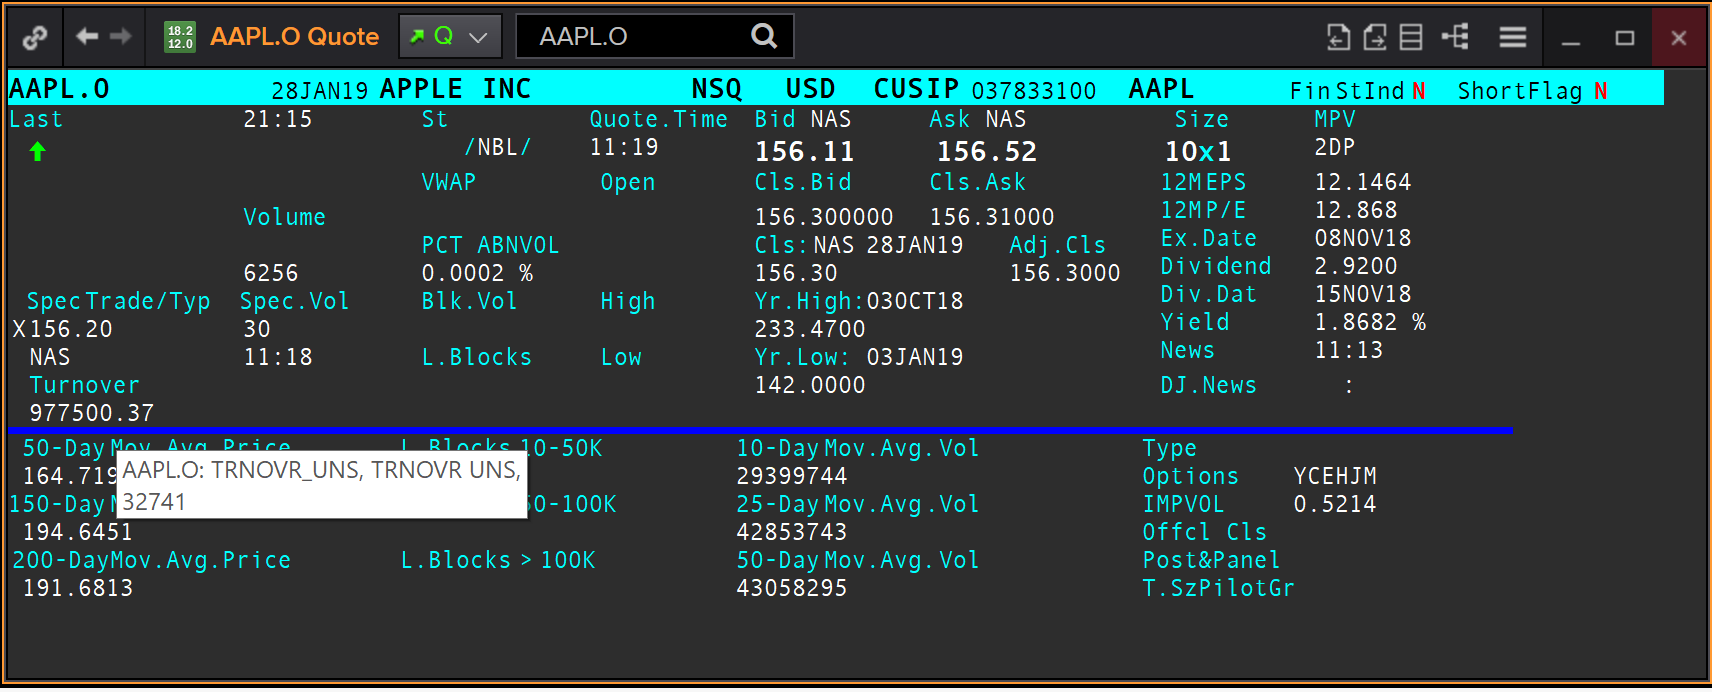
Real-time fields is what you see in the Quote app (<F4> in Eikon). You can hover over a specific value and it will give you the field name. For instance, Apple's shares:

Real-time fields will be capitalized and, sometimes, have a CF_ prefix (for common field).

Reference data fields will have a 'TR.' prefix, so if you see it in the field name, it means it is coming from the reference database. TR.Volatility10D represents a value in the reference database. TR.Volume represents a series in the in the reference database.

Both real-time and reference databases can be queried by ```ek.get_data()```

Real-time vs time series

Time series database is structured a little bit differently. For each instrument we collect a number of intervals (inter-day or intraday), each interval has a set of views, which is a set of fields. With the python api you currently have access to only the default view (either the trade price (TRDPRC_1) for exchange traded instruments or last quote (CF_LAST) for contributed instruments).

In your case, VOLUME is a field of a standard view, and for my example it is equivalent of a time series request to TRDPRC_1.VOLUME data.

Time series database is accessed with ```ek.get_timeseries()```

Summary

So, the correct way to structure the request is the following:

```ek.get_data(['DIA.N', 'SPY.N'], ['TR.Volatility10D','CF_VOLUME'])``` for the real-time volume and 10D volatility (not including today).

```ek.get_timeseries(['DIA.N', 'SPY.N'], ['VOLUME'])``` for the time series.


icon clock
10 |1500

Up to 2 attachments (including images) can be used with a maximum of 512.0 KiB each and 1.0 MiB total.

Upvotes
6 4 2 6

Wow this is a great answer!!! Thank you so much. Some follow up clarifications if you don't mind:

"TRDPRC_1.VOLUME" is not the days trading volume, but only the volume of the very last trade that happened at the stated time, which is why it is bouncing all around instead of growing steadily by day. And there is no way to get a comprehensive list of all the trades as a point process/series.

  • There is no way to get a cumulative or average trading volume for historical data
  • There is no way to get historical volatility data of any sort - with only real time volatility information available.

Please let me know if my understanding here now is correct about this, thanks!

-- Jonathan

icon clock
10 |1500

Up to 2 attachments (including images) can be used with a maximum of 512.0 KiB each and 1.0 MiB total.

Upvote
4.6k 26 7 22

@lansey

TRDPRC_1.VOLUME, as well as CF_VOLUME and TR.Volume in fact represent the accumulated volume information for the day.

The easiest way to get average volume is to pass a ```AVG``` function to the get_data request, for instance, this will give you the average volume for the last 10 days:

ek.get_data('AAPL.O', ['AVG(TR.Volume)'], {'SDate':'0D', 'EDate': '-9D'})

I have not found a way to get volatility data as series, but I encourage you to contact your local Refinitiv support desk, since this is a content question. They will help you model what you want in Excel, which is then portable into python.

icon clock
10 |1500

Up to 2 attachments (including images) can be used with a maximum of 512.0 KiB each and 1.0 MiB total.

Write an Answer

Hint: Notify or tag a user in this post by typing @username.

Up to 2 attachments (including images) can be used with a maximum of 512.0 KiB each and 1.0 MiB total.