Upgrade from Eikon -> Workspace. Learn about programming differences.

For a deeper look into our Eikon Data API, look into:

Overview |  Quickstart |  Documentation |  Downloads |  Tutorials |  Articles

question

Upvotes
Accepted
56 3 4 4

Importing specialized Eikon data into Jupyter Notebook

Hi there,

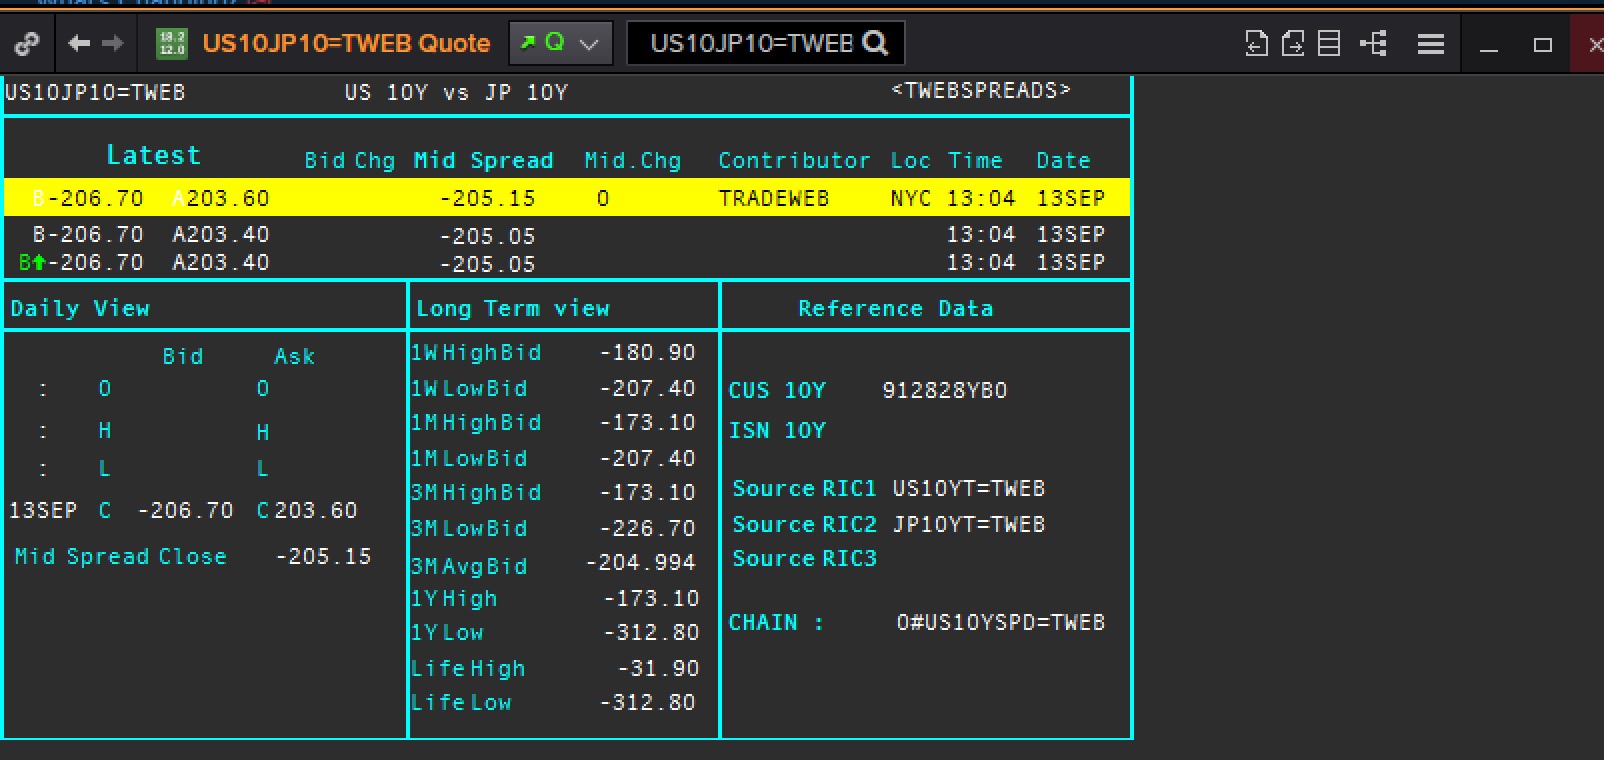
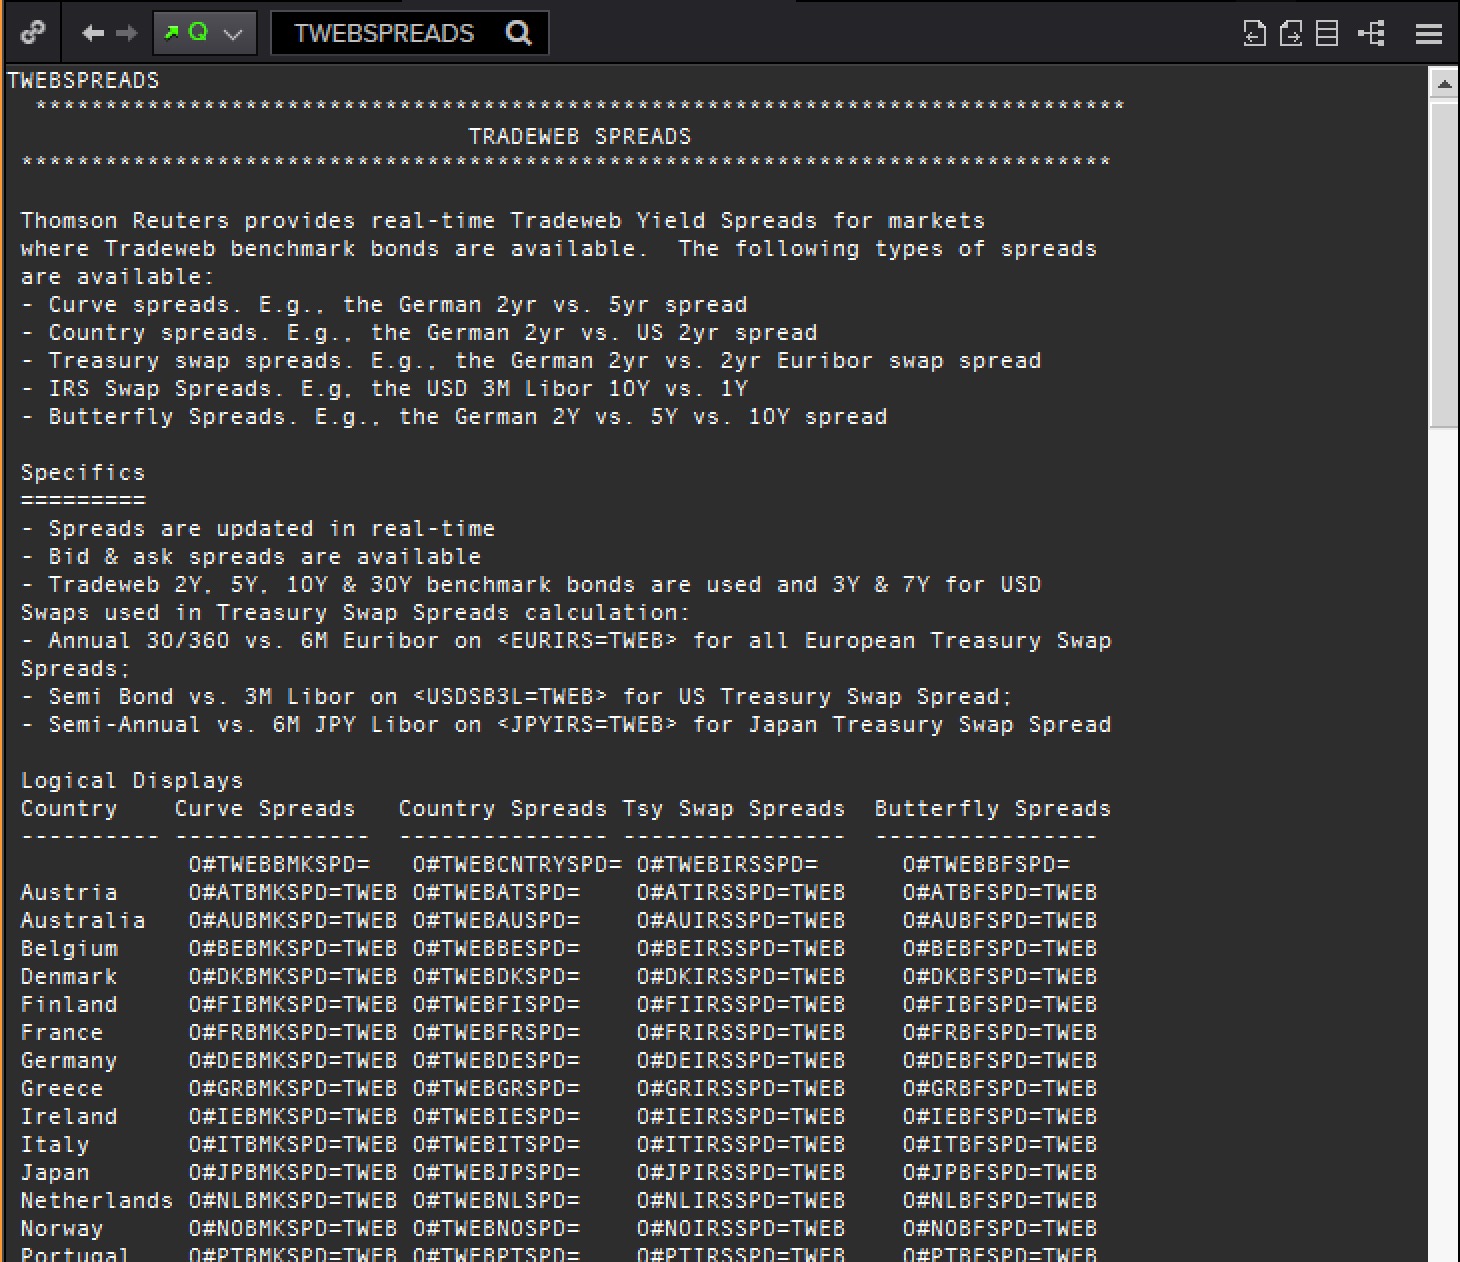
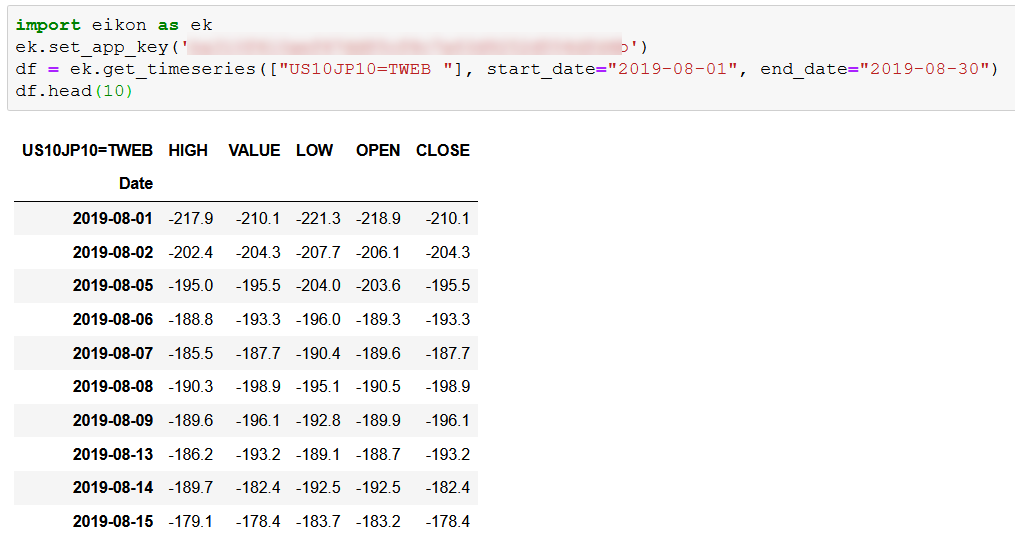
There are many charts I have personally set on my Eikon. For example, a spread between the US 10YT and Japanese 10YT, a correlation between USDJPY and the US 10YT and so on. Can I import these specialized Eikon data into Jupyter Notebook by API?

Thanks,

eikoneikon-data-apipythonrefinitiv-dataplatform-eikonworkspaceworkspace-data-apidatajupyter-notebook
icon clock
10 |1500

Up to 2 attachments (including images) can be used with a maximum of 512.0 KiB each and 1.0 MiB total.

Hello @junichi.ishikawa

Thank you for your participation in the forum. Is the reply below satisfactory in resolving your query?

If yes, please click the 'Accept' text next to the reply. This will guide all community members who have a similar question. Otherwise please post again offering further insight into your question.

Thanks,

AHS

Please be informed that a reply has been verified as correct in answering the question, and has been marked as such.

Thanks,


AHS

Upvotes
Accepted
18.2k 21 13 21

Hi Jnichi-san

I believe that the analysis is being done on the Eikon Desktop application.

You have to use API to retrieve raw data point and calculate analysis by yourselves on the Python code.

There are a few ADC(Analytic Data Cloud) function which you can apply to the data fields.

Such as this example: REL function, The REL function returns the value of a data item of an identifier relative to the symbol selected.


ahs.png (76.2 KiB)
icon clock
10 |1500

Up to 2 attachments (including images) can be used with a maximum of 512.0 KiB each and 1.0 MiB total.

Upvotes
56 3 4 4

Hi Chavalit,

Thank you for your reply.

Can I set up new RIC code on my Eikon before importing market data into Jupyter notebook. For example, the specialized RIC code for a spread between US10YT and US2YT is "Spread1". I want to simplify programming code when I use Python as much as possible.

Thanks,

icon clock
10 |1500

Up to 2 attachments (including images) can be used with a maximum of 512.0 KiB each and 1.0 MiB total.

Upvotes
18.2k 21 13 21

Hi @junichi.ishikawa

This is not possible.

However, I will forward your feedback to product manager.

icon clock
10 |1500

Up to 2 attachments (including images) can be used with a maximum of 512.0 KiB each and 1.0 MiB total.

Upvotes
644 4 7 8

If your main need is spreads data Eikon provides a full universe of Tradeweb spread RICs ... For example the Japanese/US 10s/10s comparison you mentioned would be US10JP10=TWEB

I recommend checking out the TWEBSPREADS guide to view the full universe. Also on the RatesViews App (RV) there are many other exmaples of curve and country spreads for use/correlation.

I hope this is helpful.


icon clock
10 |1500

Up to 2 attachments (including images) can be used with a maximum of 512.0 KiB each and 1.0 MiB total.

Upvotes
56 3 4 4

Thanks all.

icon clock
10 |1500

Up to 2 attachments (including images) can be used with a maximum of 512.0 KiB each and 1.0 MiB total.

Upvotes
18.2k 21 13 21

Thanks @James.Perkins for the RIC info.


In this example, that would be the following code:


ahs0.png (45.1 KiB)
icon clock
10 |1500

Up to 2 attachments (including images) can be used with a maximum of 512.0 KiB each and 1.0 MiB total.

Write an Answer

Hint: Notify or tag a user in this post by typing @username.

Up to 2 attachments (including images) can be used with a maximum of 512.0 KiB each and 1.0 MiB total.