Upgrade from Eikon -> Workspace. Learn about programming differences.

For a deeper look into our Eikon Data API, look into:

Overview |  Quickstart |  Documentation |  Downloads |  Tutorials |  Articles

question

Upvotes
Accepted
1 1 1 0

How can I get historical data for SPX3MO=R using the Python API?

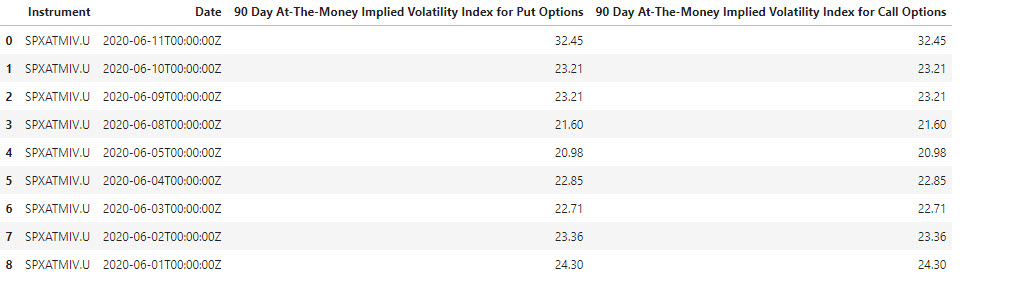
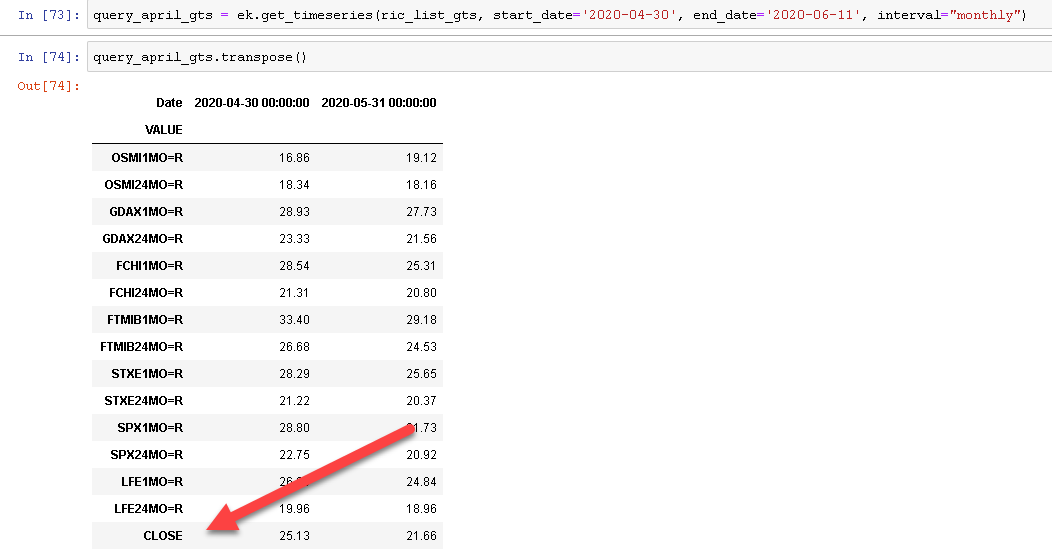
I'm trying to retrieve the historical data for SPX3MO=R using the Python API. CF_CLOSE, CF_LAST fields as available, but they only give me the current data. However, when I open the daily charts I see the historical data is available. Can you please advise?


Sample formula used: ek.get_data("SPX3MO=R", "HST_CLOSE", {'SDate':'2020-04-30'})


I would like to see historical data at the longer date. Looking forward for your help.

eikoneikon-data-apipythonrefinitiv-dataplatform-eikonworkspaceworkspace-data-api
icon clock
10 |1500

Up to 2 attachments (including images) can be used with a maximum of 512.0 KiB each and 1.0 MiB total.

Hello @Paco Sebastian.Sunico,

Thank you for your participation in the forum. Is the reply below satisfactory in resolving your query?

If yes, please click the 'Accept' text next to the reply. This will guide all community members who have a similar question. Otherwise please post again offering further insight into your question.

Thanks,

AHS

Please be informed that a reply has been verified as correct in answering the question, and has been marked as such.

Thanks,


AHS

Upvote
Accepted
25.3k 87 12 25

Hi @Paco Sebastian.Sunico

The following provides me with historical data

ric = 'SPX3MO=R'
startdate = '2015-01-01T00:00:00'
enddate = '2020-05-12T00:00:00'
interval = 'daily'
 
df = ek.get_timeseries(
        [ric],
        start_date=startdate,
        end_date=enddate,
        interval=interval )
print(df)

outputs:

SPX3MO=R    
VALUE Date             
2015-01-02  15.37 
2015-01-05  16.74 
2015-01-06  17.53 
2015-01-07  16.45 
2015-01-08  14.97 
...           ... 
2020-05-06  29.86 
2020-05-07  28.00 
2020-05-08  25.70 
2020-05-11  24.70 
2020-05-12  28.22

You can find more details on the get_timeseries method here

Note that not all the time intervals + fields listed in the documentation are available for all RICs.

If you do want to discuss what data is available you can create a Content ticket via MyRefinitiv


icon clock
10 |1500

Up to 2 attachments (including images) can be used with a maximum of 512.0 KiB each and 1.0 MiB total.

@Umer Nalla Per the user, he uses get_data formula. He needs the name of the field that can be used, please. Can you please advise? Looking forward for your response.

Hi @Romerson.Gadil

I have been advised that you cannot get timeseries of price history for this RIC using get_data.
The get_data method provides equivalent capabilities to =TR function in Eikon Excel.
If the Eikon Helpdesk can find a way to retrieve the required data using =TR function, then the same fields and parameters can be used in get_data. But if the Eikon Helpdesk cannot find a way to use =TR to retrieve the historical data for this RIC, then get_data cannot be used for this purpose either.


Hi Umer,


The user has a followup.


"I'm essentially trying to get implied volatilities ATM data for equity indices. Can you please advise what's the best way to do it? SPX3MO=R looked like a good candidate RIC for SPX, but perhaps there are other better ones. "


I tried checking the link you have provided however I am afraid I may not be able to translate the right answers. https://community.developers.refinitiv.com/questions/45848/how-can-i-pull-historical-implied-vol-surfaces-to.html


Looking forward for your usual help. Thank you in advance.

Hi @Romerson.Gadil

This is really a question for the Content team - as I explained during our chat, this forum is aimed to answer "how to" types of questions about using Refinitiv APIs - we advise those which questions such as 'how do I get such data' or 'which RIC is the correct one for this data' to raise a content ticket.

Hi,

Thanks for help so far, very useful.

I've changed the code to use get_timeseries, but now some data comes with "CLOSE" label instead of the relevant identifier. Any idea how to fix this, please?

Thanks,

Jakub

1591957539583.png (36.0 KiB)
Show more comments

As SPX3MO=R is a Volatility Surface, the client may be interested in our Instrument Pricing Analytics data - which is available on the Refinitiv Data Platform and includes Volatility Surface data.

Here is an article on the Vol Surfaces offering Instrument Pricing Analytics - Volatility Surfaces and Curves

IF they are interested, they should reach out to their Refinitiv Account Team to discuss further.

Hi @Romerson.Gadil

You can consider using an alternative RIC code SPXATMIV.U that gives you the market expectation of 30,60 and 90 day forward-looking volatility.

ek.get_data('SPXATMIV.U','TR.90DAYATTHEMONEYIMPLIEDVOLATILITYINDEXFORPUTOPTIONS.date','TR.90DAYATTHEMONEYIMPLIEDVOLATILITYINDEXFORPUTOPTIONS','TR.90DAYATTHEMONEYIMPLIEDVOLATILITYINDEXFORCALLOPTIONS'],{"Sdate":'0D', "Edate":'-10D'})

ahs.jpg (77.1 KiB)
Upvotes
1 0 2 2

This query was raised by an external user Jakub Januszewski from UBS AG London Branch. Please treat this query as urgent as the client is working to retrieve the historical data. We look forward for your response.

icon clock
10 |1500

Up to 2 attachments (including images) can be used with a maximum of 512.0 KiB each and 1.0 MiB total.

Upvotes
25.3k 87 12 25

Hi @jakub.januszewski

Those two - RICS JNI1MO=R, JNI24MO=R - return the value in a 'CLOSE' field, whereas the others return the value in a 'VALUE' field.

I am not a content expert, so cannot explain why the fields returned are different.

One workaround would be to request the two sets of RICs separately - otherwise, pleaseask the Content Helpdesk why they field names differ.


icon clock
10 |1500

Up to 2 attachments (including images) can be used with a maximum of 512.0 KiB each and 1.0 MiB total.

Write an Answer

Hint: Notify or tag a user in this post by typing @username.

Up to 2 attachments (including images) can be used with a maximum of 512.0 KiB each and 1.0 MiB total.