Upgrade from Eikon -> Workspace. Learn about programming differences.

For a deeper look into our Eikon Data API, look into:

Overview |  Quickstart |  Documentation |  Downloads |  Tutorials |  Articles

question

Upvotes
Accepted
1 1 1 1

Eikon Codebook - Matplotlib Bar Chart Open Interest by Strike

Hi Everyone,

I am using python in codebook and trying to graph open interest by strike in a chart. I am trying to get it to illustrate the calls in one color and the puts in another color. I can get as far as the graph, however, I can not figure out how to break out the PUTCALLIND to illustrate put vs call with different colors. Any guidance would be greatly apprecaited. Thanks!


import numpy as np

import pandas as pd

import matplotlib.pyplot as plt

%matplotlib inline

import seaborn as sns

plt.style.use('seaborn-dark-palette')

import warnings

warnings.filterwarnings('ignore')


import eikon as tr

tr.set_app_key('DEFAULT_CODE_BOOK_APP_KEY')

df, e= tr.get_data('0#IBM*.U',fields = ['PUTCALLIND','STRIKE_PRC','OPINT_1'])

df

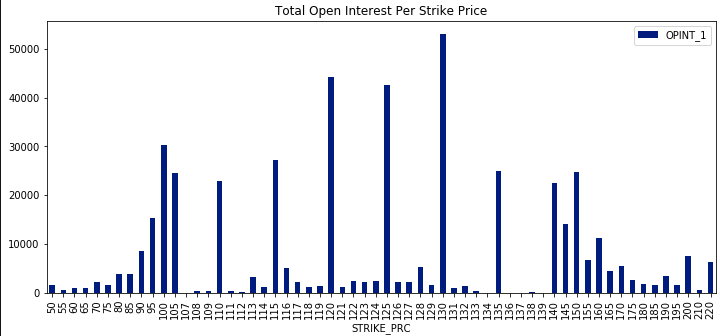
df1 = df.groupby(['STRIKE_PRC']).sum()

df1.plot(figsize=(12,5), title='Total Open Interest Per Strike Price', kind='bar');

eikoneikon-data-apipythonrefinitiv-dataplatform-eikonworkspaceworkspace-data-apicodebook
1615833642088.png (10.8 KiB)
1615833593538.png (24.9 KiB)
icon clock
10 |1500

Up to 2 attachments (including images) can be used with a maximum of 512.0 KiB each and 1.0 MiB total.

@brandonwarnecke

Thank you for your participation in the forum.

Is the reply below satisfactory in answering your question?

If yes please click the 'Accept' text next to the reply. This will guide all community members who have a similar question. Otherwise please post again offering further insight into your question.


Thanks,

AHS

Hello @brandonwarnecke

Please be informed that a reply has been verified as correct in answering the question, and has been marked as such.

Thanks,


AHS

1 Answer

· Write an Answer
Upvotes
Accepted
32.2k 40 11 20

Hello @brandonwarnecke,

Try:

import numpy as 
import pandas as 
import matplotlib.pyplot as p
%matplotlib inli
import seaborn as sns

plt.style.use('seaborn-dark-palette')

import warnings

warnings.filterwarnings('ignore')

import eikon as tr

tr.set_app_key('DEFAULT_CODE_BOOK_APP_KEY')

df, e= tr.get_data('0#IBM*.U',fields = ['PUTCALLIND','STRIKE_PRC','OPINT_1'])

df1 = df.groupby(['STRIKE_PRC','PUTCALLIND']).sum()
                   
df1.unstack().plot(figsize=(12,5), title='Total Open Interest Per Strike Price', kind='bar', color =['black','red']);

For me results in:


putcall.gif (13.6 KiB)
icon clock
10 |1500

Up to 2 attachments (including images) can be used with a maximum of 512.0 KiB each and 1.0 MiB total.

Write an Answer

Hint: Notify or tag a user in this post by typing @username.

Up to 2 attachments (including images) can be used with a maximum of 512.0 KiB each and 1.0 MiB total.