question

Upvotes
Accepted
30 4 6 13

Manage Data With Pandas Dataframe

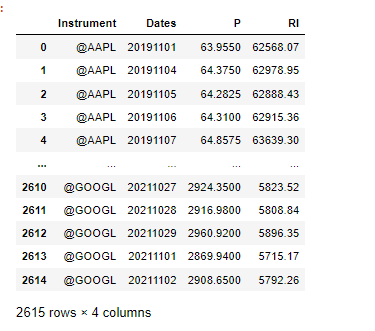
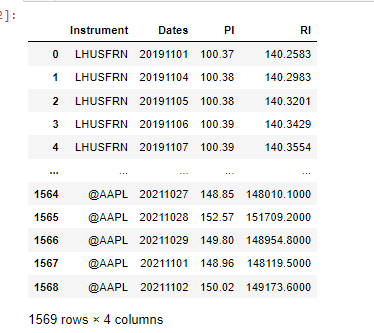
Hello, would be possible for you to create an example in python that populates a Pandas dataframe with the following data (4 columns, same order below) for a custom list of tickers (let's say for example 10 tickers of your choice), in a given time frame (i.e last 2 years) using DS data:

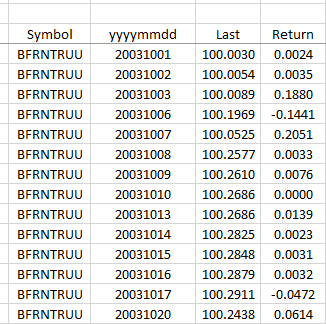
ticker, date in yyyymmdd format, last price, total return (percent change vs previous period) lagged backward one period.


The script should work on whatever timeframe is selected by the user (daily, weekly, monthly). The dataframe will be indexed on the tickers so to have all data for all tickers in one dataframe only.

The output (example with daily data) should be something like in the gif attached (so you could understand what I mean for "lagged" one period) ... here Capture.PNG, and then should continue below with the data of the second ticker, the third ... etc

I need this as a start point to understand how to download the data as well as how to handle their order (columns) and then carry out other studies.

Many thanks!

datastream-apipandas
capture.png (14.3 KiB)
icon clock
10 |1500

Up to 2 attachments (including images) can be used with a maximum of 512.0 KiB each and 1.0 MiB total.

Hello @Aleniles

Thank you for your participation in the forum. Is the reply below satisfactory in resolving your query?


If so please can you click the 'Accept' text next to the appropriate reply? This will guide all community members who have a similar question.

Thanks,


AHS


Please be informed that a reply has been verified as correct in answering the question, and has been marked as such.

Thanks,


AHS


Upvotes
Accepted
78.8k 250 52 74

@Aleniles

I have created an example to get the Total Return Index (RI) and Price - Trade (P) data types of the following items.

'@AAPL,@MSFT,@AMZN,@TSLA,@GOOGL'

You can use the Datastream navigator to search for items and data types.

I used the DatastreamDSWS python package and the get_data method to get historical data.

import DatastreamDSWS as DSWS
username = "username"
password = "password"
ds = DSWS.Datastream(username = username, password = password)

data = ds.get_data('@AAPL,@MSFT,@AMZN,@TSLA,@GOOGL', ['P','RI'], start='-2Y', end='0D', kind=1, freq='D')

df = data.iloc[: , data.columns.get_level_values(1) == 'P'].melt(col_level=0, ignore_index=False, value_name='P')

tmp_df = data.iloc[: , data.columns.get_level_values(1) == 'RI'].melt(col_level=0, ignore_index=False, value_name='RI')

df["RI"] = tmp_df["RI"]
df.reset_index(inplace=True)
df.Dates = df.Dates.apply(lambda x: x.replace('-',''))
df[["Instrument","Dates","P","RI"]]

The output is:

1635915400405.png


1635915400405.png (19.0 KiB)
icon clock
10 |1500

Up to 2 attachments (including images) can be used with a maximum of 512.0 KiB each and 1.0 MiB total.

Upvotes
30 4 6 13

Fantastic!

I just amended a little bit the code so to have also the shift I need in the return column (last column).

Many thanks!


data = ds.get_data('@AAPL,@MSFT,@AMZN,@TSLA,@GOOGL', ['P','RI'], start='-2Y', end='0D', kind=1, freq='D')

df = data.iloc[: , data.columns.get_level_values(1) == 'P'].melt(col_level=0, ignore_index=False, value_name='P')
tmp_df = data.iloc[: , data.columns.get_level_values(1) == 'RI'].melt(col_level=0, ignore_index=False, value_name='RI')
df["RI"] = tmp_df["RI"]

# shift total return backward one period
df["CHG"]=(100*(df['RI']/df['RI'].shift(1)-1).shift(-1))

df.reset_index(inplace=True)
df.Dates = df.Dates.apply(lambda x: x.replace('-',''))
df[["Instrument","Dates","P","RI"]]
# set instrument as an index
df.set_index('Instrument',inplace=True)

df.head(10)
icon clock
10 |1500

Up to 2 attachments (including images) can be used with a maximum of 512.0 KiB each and 1.0 MiB total.

Upvotes
30 4 6 13

One last question, how to adjust the code for tickers like these one ?

LHUSFRN is the price index

LHUSFRN(IN)+100 is the total return index

or

MSUSAML(MSPI) Price Index

MSUSAML(MSRI) Total Return Index


I mean how to rewrite the part below for those types of tickers ?

data = ds.get_data('LHUSFRN,@MSFT,@AMZN,@TSLA,@GOOGL', ['P','RI'], start='-2Y', end='0D', kind=1, freq='D') 
icon clock
10 |1500

Up to 2 attachments (including images) can be used with a maximum of 512.0 KiB each and 1.0 MiB total.

Upvotes
78.8k 250 52 74

@Aleniles

It uses different data types to get the Price Index and Total Return Index values so I use a dictionary to map fields.

fields_map = {'P':"PI", "IN+100":"RI","MSPI":"PI","MSRI":"RI"}

The code looks like this:

fields_map = {'P':"PI", "IN+100":"RI","MSPI":"PI","MSRI":"RI"}


data = ds.get_data('LHUSFRN(P), LHUSFRN(IN)+100,MSUSAML(MSPI),MSUSAML(MSRI), @AAPL(P), @AAPL(RI)', 
                   start='-2Y', end='0D', kind=1, freq='D')

#Rename the multi-index columns
column_index0 = [x.split('(')[0] for x in data.columns.get_level_values(0)]
column_index1 = [x.split('(')[1].replace(')','') for x in data.columns.get_level_values(0)]

#use the dictionary to rename data types
column_index1_rename = []
for dt in column_index1:
    if dt in fields_map:
        column_index1_rename.append(fields_map[dt])
    else:
        column_index1_rename.append(dt)


data.columns = data.columns.from_tuples(list(zip(column_index0,column_index1_rename)),names=['Instrument', 'Field'])

df = data.iloc[: , data.columns.get_level_values(1) == 'PI'].melt(col_level=0, ignore_index=False, value_name='PI')

tmp_df = data.iloc[: , data.columns.get_level_values(1) == 'RI'].melt(col_level=0, ignore_index=False, value_name='RI')

df["RI"] = tmp_df["RI"]

df.reset_index(inplace=True)

df.Dates = df.Dates.apply(lambda x: x.replace('-',''))

df[["Instrument","Dates","PI","RI"]]

The output is:

1635935833473.png


1635935833473.png (18.8 KiB)
icon clock
10 |1500

Up to 2 attachments (including images) can be used with a maximum of 512.0 KiB each and 1.0 MiB total.

Upvotes
30 4 6 13

Very kind of you!

One more question: what if I need to retrieve same kind of output for a couple of formulas instead? Like the following (even by writing another separate code if it is not possible to integrate it into the previous one):

(0.6*REBE#(S&PCOMP(RI)))+(0.4*(REBE#(LHAGGBD(IN)+100)))

(REBE#(CPRD#(1+((PCH#(MSACWF$(RI),1M)*0.006)+((PCH#(LHAGGBD(IN)+100,1M))*0.004)))))-100

I mean do you think is possibile to pull out data from a formula as well or do I need to convert it into python code?

Thanks!

icon clock
10 |1500

Up to 2 attachments (including images) can be used with a maximum of 512.0 KiB each and 1.0 MiB total.

@Aleniles

Those formulas return the following data.

ds.get_data('(0.6*REBE#(S&PCOMP(RI)))+(0.4*(REBE#(LHAGGBD(IN)+100))),(REBE#(CPRD#(1+((PCH#(MSACWF$(RI),1M)*0.006)+((PCH#(LHAGGBD(IN)+100,1M))*0.004)))))-100', start='-2Y', end='0D', kind=1, freq='D')

1636017279559.png

What output would you like to see?

1636017279559.png (29.4 KiB)

Write an Answer

Hint: Notify or tag a user in this post by typing @username.

Up to 2 attachments (including images) can be used with a maximum of 512.0 KiB each and 1.0 MiB total.