question

Upvotes
Accepted
11 6 8 15

Get data of "TR."-variables using Python API of Datastream Web Services (dsws)

Hi everyone,

I try to get mean analyst forecasts for a specific company (Volkswagen) as a daily time series. When I do this in Excel, this works with the variable "TR.EPSMean". The respective excel formula is:

TR("VOWG_p.DE";"TR.EPSMean;TR.EPSPeriodMonth;TR.EPSPeriodYear";"Period=FY1 Frq=D SDate=2010-01-01 EDate=2021-11-02 CH=Fd RH=IN;date";B2)

The output looks like this:
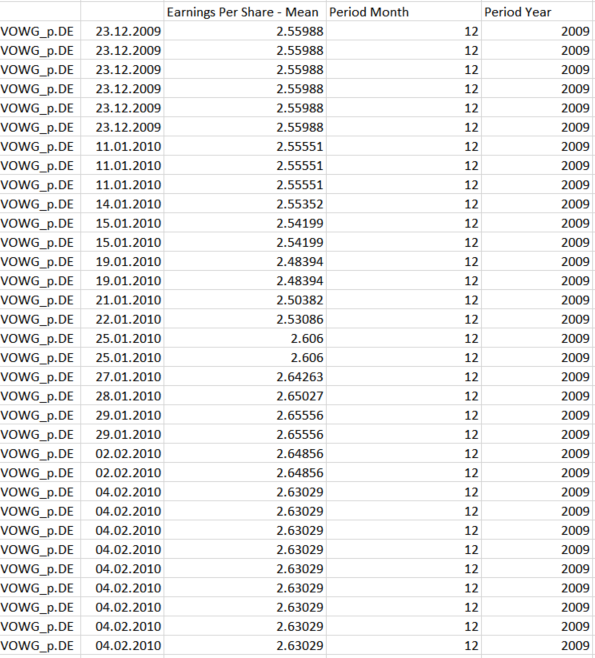
exceloutput.png

Now I try to replicate this using python and the Datastream Web Services API. I tried the following:

import DatastreamDSWS as dsws
ds = dsws.Datastream(username='<USERNAME>', password='<PASSWORD>')
data=ds.get_data(tickers='<VOWG_p.DE>',fields=['TR.EPSMean'], start='-10Y',kind=1)

Unfortunately, this returns simply "None" for the variable TR.EPSMean, Whats my mistake here?


Thank you very much for your help in advance!

dsws-api
exceloutput.png (210.6 KiB)
icon clock
10 |1500

Up to 2 attachments (including images) can be used with a maximum of 512.0 KiB each and 1.0 MiB total.

Hello @Eikon10

Thank you for your participation in the forum. Is the reply below satisfactory in resolving your query?


If so please can you click the 'Accept' text next to the appropriate reply? This will guide all community members who have a similar question.

Thanks,


AHS


Please be informed that a reply has been verified as correct in answering the question, and has been marked as such.

Thanks,


AHS


1 Answer

· Write an Answer
Upvotes
Accepted
22.1k 59 14 21

Hello @Eikon10,

Please see the Datastream Navigator for the list of fields that can be used for your instrument. Here is a sample request -

>>> df1 = ds.get_data(tickers='<VOWG_p.DE>', fields=['AF', 'CAI', 'DSCD', 'GEOG', 'ISIN', 'LOC', 'SECD', 'ACUR', 'ECUR', 'PYD', 'LYE', 'DEF', 'DY', 'EXDSCD', 'EXMNEM', 'EPS', 'EPSD', 'EPSF', 'EPSFD', 'Estat', 'EXNAME', 'ECNAME', 'ENAME', 'EPS1D', 'EPS2D', 'MVFF', 'GEOGC', 'GEOGN', '897E', '400E', 'ISINID', 'ISOCUR', 'MV', 'MVC', 'EPS1', 'EPS2', 'MNEM', 'NAME', 'WC01001', 'WC01001A', 'NOSH', 'EPS1PER', 'EPS2PER', 'PA', 'PB', 'PCUR', 'PH', 'PHP', 'PL', 'OP'], kind=1)
>>> df1
Instrument <VOWG_p.DE>                                       ...
Field               AF    CAI  DSCD  GEOG  ISIN   LOC  SECD  ...      PA      PB  PCUR      PH     PHP      PL     OP
Dates                                                        ...
2020-11-02           1  10.35  None  None  None  None  None  ...  127.76  127.68  None  128.92  128.92  122.96  133.8
2020-11-03           1  10.35  None  None  None  None  None  ...  131.94  131.88  None  132.68  132.68  129.14  133.8
2020-11-04           1  10.35  None  None  None  None  None  ...  131.76  131.68  None  133.10  133.10  127.28  133.8
2020-11-05           1  10.35  None  None  None  None  None  ...  136.04  135.96  None  136.50  136.50  132.62  133.8
2020-11-06           1  10.35  None  None  None  None  None  ...  133.40  133.32  None  136.44  136.44  132.62  133.8
...                ...    ...   ...   ...   ...   ...   ...  ...     ...     ...   ...     ...     ...     ...    ...
2021-10-27           1  10.35  None  None  None  None  None  ...  204.20  204.10  None  206.85  206.85  200.10  133.8
2021-10-28           1  10.35  None  None  None  None  None  ...  195.70  195.62  None  200.40  200.40  194.18  133.8
2021-10-29           1  10.35  None  None  None  None  None  ...  193.38  193.32  None  195.96  195.96  191.86  133.8
2021-11-01           1  10.35  None  None  None  None  None  ...  194.68  194.64  None  196.02  196.02  193.00  133.8
2021-11-02           1  10.35  None  None  None  None  None  ...  194.02  193.98  None  195.60  195.60  192.62  133.8

[262 rows x 50 columns]
>>>
>>>
>>> df2 = ds.get_data(tickers='<VOWG_p.DE>', fields=['PO', 'P', 'PI', 'PTBV', 'APC', 'PC', 'PE1', 'PE2', 'PE', 'PG1', 'PG2', 'TIME', 'RI', 'VO', 'TYPE', 'UP', 'P.U'], kind=1)
>>> df2
Instrument <VOWG_p.DE>                                         ...
Field               PO       P     PI  PTBV   APC    PC   PE1  ...   PG2  TIME       RI      VO  TYPE      UP   P.U
Dates                                                          ...
2020-11-02      126.26  127.78  556.2  0.58  None  1.83  None  ...  None  None  1039.65  1262.8  None  127.78  None
2020-11-03      129.66  131.74  573.4  0.59  None  1.89  None  ...  None  None  1071.87  1180.0  None  131.74  None
2020-11-04      128.50  132.08  574.9  0.59  None  1.89  None  ...  None  None  1074.64  1527.2  None  132.08  None
2020-11-05      133.94  135.92  591.6  0.61  None  1.95  None  ...  None  None  1105.88  1468.2  None  135.92  None
2020-11-06      135.00  133.16  579.6  0.60  None  1.91  None  ...  None  None  1083.42  1279.9  None  133.16  None
...                ...     ...    ...   ...   ...   ...   ...  ...   ...   ...      ...     ...   ...     ...   ...
2021-10-27      205.50  203.90  887.5  0.92  None  2.92  None  ...  None  None  1697.64   793.6  None  203.90  None
2021-10-28      199.46  194.78  847.8  0.88  None  2.79  None  ...  None  None  1621.70  1442.6  None  194.78  None
2021-10-29      194.28  193.82  843.7  0.87  None  2.78  None  ...  None  None  1613.71  1222.3  None  193.82  None
2021-11-01      194.76  194.66  847.3  0.88  None  2.79  None  ...  None  None  1620.70   676.1  None  194.66  None
2021-11-02      194.88  193.44  842.0  0.87  None  2.77  None  ...  None  None  1610.55   891.7  None  193.44  None

[262 rows x 17 columns]
icon clock
10 |1500

Up to 2 attachments (including images) can be used with a maximum of 512.0 KiB each and 1.0 MiB total.

Write an Answer

Hint: Notify or tag a user in this post by typing @username.

Up to 2 attachments (including images) can be used with a maximum of 512.0 KiB each and 1.0 MiB total.