question

Upvotes
Accepted
30 4 6 13

Plotly Not Working in CODEBK?

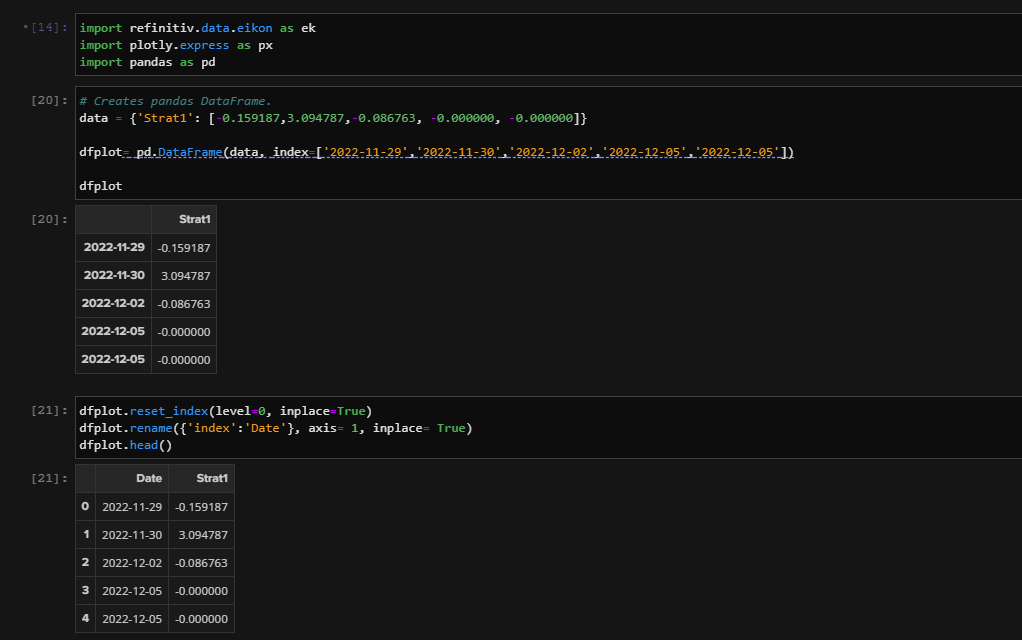
Hello, trying to use plotly to plot this simple dataframe (dfplot):


     index    Strat1
237 2022-11-29 -0.159187
238 2022-11-30 3.094787
239 2022-12-01 -0.086763
240 2022-12-02 -0.000000
241 2022-12-05 -0.000000
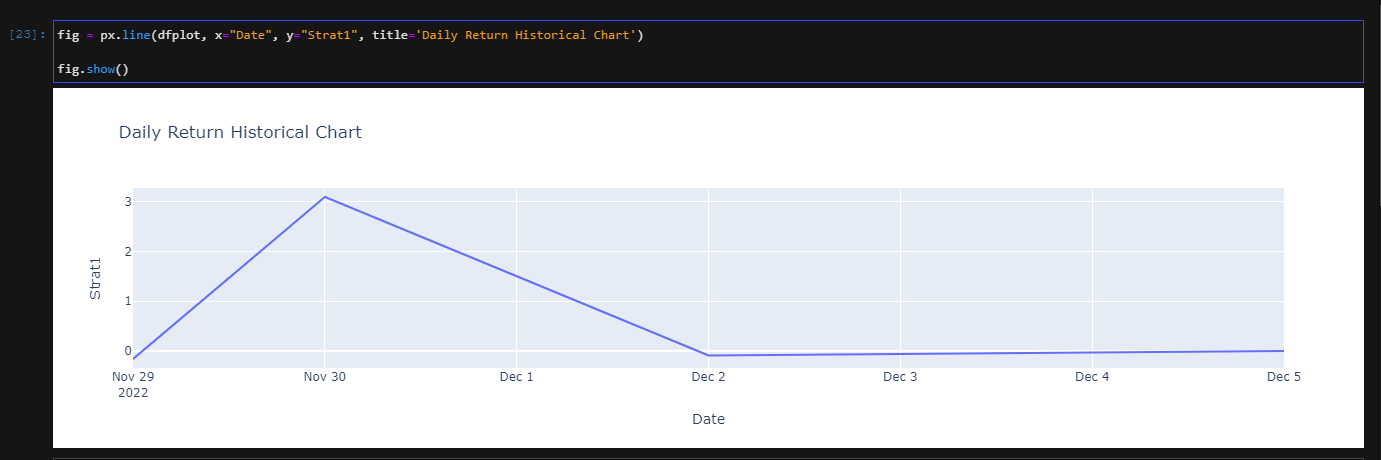

Using this code:

import plotly.express as px
fig = px.line(dfplot, x="Date", y="Daily Return", title='Daily Return Historical Chart')
fig.show()

But I get the error:

AttributeError: module 'dask.array' has no attribute 'lib'
AttributeError                            Traceback (most recent call last)
/tmp/ipykernel_200/32131141.py in <module>
----> 1 import plotly.express as px

Is there any dependencies not working properly ?

#technologycodebookdatastream
icon clock
10 |1500

Up to 2 attachments (including images) can be used with a maximum of 512.0 KiB each and 1.0 MiB total.

Upvotes
Accepted
25.1k 57 17 14

Hello @Aleniles

Thank you for the information. I checked my Eikon (version 4.0.60018, not the latest). The CodeBook App on my Eikon is version 3.0 (March 2022) with the following dependencies versions:

  • JupyterLab 3.2.4
  • Python 3.8.13
  • Plotly 5.4.0
  • Dask 2021.11.2

You can check the version from the CodeBook "_Changelog.md" file in the main folder as follows:

codebook-ver.png

I highly recommend you contact the Eikon support team directly to help you with this CodeBook app and libraries issue.

contact-eikon-support.png

In the meantime, can you try the CodeBook app on the Eikon Web version? Please find more detail in this Use CodeBook on Web Browser article.


icon clock
10 |1500

Up to 2 attachments (including images) can be used with a maximum of 512.0 KiB each and 1.0 MiB total.

Upvotes
25.1k 57 17 14

Hello @Aleniles

Are you using the latest version of the Workspace desktop application?

I am testing the following code with CodeBook app on Workspace version 1.19.448 and it works fine.

Firstly, I create the dataframe object and set the "Date" column to be a normal column instead.

Code:

# Creates pandas DataFrame.
data = {'Strat1': [-0.159187,3.094787,-0.086763, -0.000000, -0.000000]}
dfplot= pd.DataFrame(data, index=['2022-11-29','2022-11-30','2022-12-02','2022-12-05','2022-12-05'])
# Reset index to include Date as a data column
dfplot.reset_index(level=0, inplace=True)
dfplot.rename({'index':'Date'}, axis= 1, inplace= True)

Result:

plotly-1.png

Then I plot the graph with plotly:

fig = px.line(dfplot, x="Date", y="Strat1", title='Daily Return Historical Chart')
fig.show()

Result

plotly-2.png


plotly-1.png (49.1 KiB)
plotly-2.png (26.4 KiB)
icon clock
10 |1500

Up to 2 attachments (including images) can be used with a maximum of 512.0 KiB each and 1.0 MiB total.

Hello @Aleniles

You can check the version of Workspace from the Workspace desktop app --> Help (?) menu --> "About Refinitiv Workspace" button.

check-ws-version.png

Upvotes
30 4 6 13

No, it still doesn't work because the error is directly on the "import plotly.express as px" instruction. That's why I am thinking about "dependencies" problems.

Btw I do not have the same view as you in the workspace. I am running CODEBOOK with Datastream data inside Refinitiv Desktop Eikon 4.0.54 with JupyterLab 1.2.7, plotly 4.8.1


. The python version is the one below.

Unfortunately I am not able to upload a picture due to IT restrictions but believe me: running a simple cell with the "import plotly.express as px" instruction gives the error I mentioned.

Python 3.8.13 | packaged by conda-forge | (default, Mar 25 2022, 06:04:10) 
Type 'copyright', 'credits' or 'license' for more information
IPython 7.31.0 -- An enhanced Interactive Python. Type '?' for help.
icon clock
10 |1500

Up to 2 attachments (including images) can be used with a maximum of 512.0 KiB each and 1.0 MiB total.

Upvotes
30 4 6 13
icon clock
10 |1500

Up to 2 attachments (including images) can be used with a maximum of 512.0 KiB each and 1.0 MiB total.

Upvotes
30 4 6 13

Many thanks.

So in the standalone version I do not have the changelog file either ... so I cannot check.

I tried to connect to the web version and here, indeed, everything works fine. So I suppose I have an outdated version of Codebook installed on my machine, I'll reach out the Refinitiv helpdesk.

One last question:

Do you know how or if it is possible to connect to external APIs using Codebook ?

I have tried this:

import yfinance as yf
Amazon = yf.Ticker("AMZN")
print(Amazon.info) 

But I am getting this:

HTTPSConnectionPool(host='finance.yahoo.com', port=443): Max retries exceeded with url: /quote/AMZN (Caused by ProxyError('Cannot connect to proxy.', OSError('Tunnel connection failed: 403 Forbidden')))

I'm wondering if there is a way to set up something (whitelisting servers, setting the SSL or Proxy properly etc) so that it could work.


icon clock
10 |1500

Up to 2 attachments (including images) can be used with a maximum of 512.0 KiB each and 1.0 MiB total.

Hello @Aleniles

Unfortunately, the CodeBook app allows connection within Refinitiv platforms (Eikon, Refinitiv Data Platform, DataStream, etc) only.
If your notebook app needs to connect to external services/APIs, you need to set up your local Jupyter Lab environment and run a notebook app in your local Jupyter instead. You can find more detail about how to set up Jupyter Lab from the following resources:

Caution!

Please contact your Refinitiv representative to confirm if you need a separate Datastream credential to run Datastream in your local environment.

Write an Answer

Hint: Notify or tag a user in this post by typing @username.

Up to 2 attachments (including images) can be used with a maximum of 512.0 KiB each and 1.0 MiB total.