question

Upvotes
Accepted
1 0 0 0

CODEBOOK for Datastream

Hello Team, I have a client with a query as below.

I am trying to use the CODEBOOK app (CODEBK) - a development environment for financial coders with a fully hosted cloud-based kernel for Python computations, closely integrated with Refinitiv.

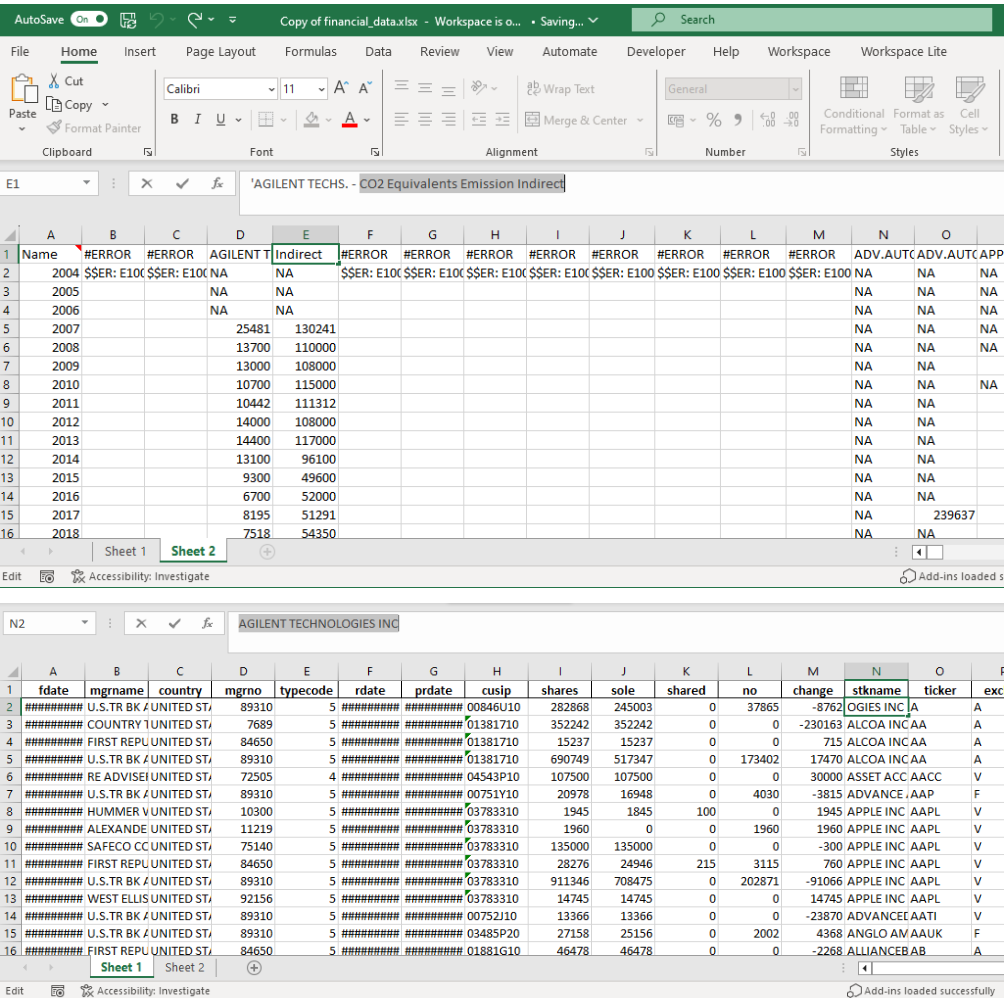
I am currently attempting to extract Scope 1 and Scope 2 emissions based on a list of ISIN codes. I have done this using batches due to the size of my dataset. However, it seems that I do not obtain the complete dataset, nor with year specification. I did use the Datastream Excel add-in for a small part of my data, just to see the output (the data is in 'Sheet 2') with this formula:

=@DSGRID('Sheet 1'!$Z$1:$Z$499567,"ENERDP024;ENERDP025","-20Y","","Y","RowHeader=true;ColHeader=true;DispSeriesDescription=false;YearlyTSFormat=false;QuarterlyTSFormat=false;MonthlyTSFormat=False","")

However, my data is too large to manage in Excel. I have attached my original dataframe with institutional holdings in 'Sheet 1'. I want to extract the scope 1 and scope 2 for each ‘rdate’ for each company ‘isin’. How can I obtain this in my Python environment? This is the code I attempted to run in my Python environment. The dataframe is exactly the same as 'Sheet 1' in the Excel file attached. Here is the code: import pandas as pd import refinitiv.data as rd import numpy as np

# Read the Excel file to get the ISIN df = pd.read_excel('financial_data.xlsx') # Adjust the path as necessary

# Generate unique list of ISINs from the DataFrame isin_list = df['ISIN'].dropna().unique().tolist()

# Function to split a list into n roughly equal parts def split_into_batches(lst, n): for i in range(0, len(lst), n): yield lst[i:i + n]

# Modify this number based on needs number_of_batches = 10 # Adjust for desired batch size

# Determine batch size batch_size = len(isin_list) // number_of_batches + (len(isin_list) % number_of_batches > 0)

# Split ISINs into smaller batches isin_batches = list(split_into_batches(isin_list, batch_size))

# Initialize session and fetch data for each batch rd.open_session()

# Initialize an empty DataFrame to store results all_data = pd.DataFrame()

for batch in isin_batches:

# Fetch data for the current batch of ISINs batch_data = rd.get_data( universe=batch, fields = [ 'TR.CO2DirectScope1(Period=FY0,Frq=FY,SDate=0,EDate=-20)', 'TR.CO2IndirectScope2(Period=FY0,Frq=FY,SDate=0,EDate=-20)' ]) # Append the fetched data to the all_data DataFrame df = pd.concat([all_data, batch_data], ignore_index=True) rd.close_session() display(df)


#technologydatastream-apicodebookesgdatastreamesg-scope
icon clock
10 |1500

Up to 2 attachments (including images) can be used with a maximum of 512.0 KiB each and 1.0 MiB total.

Hi @avinash.sonde , Could you please let us know which answer below answers your question, with the 'Accept' button to the left of it?

Hi,

Please be informed that a reply has been verified as correct in answering the question, and marked as such.

Thank you,

AHS

Upvotes
Accepted
5.8k 21 2 6

Hi @avinash.sonde ,


The data you are after seem to be on the DIB. You can test this all in Python in CodeBook.


In codebook, you can try something like this:


import refinitiv.data as rd
rd.open_session()


rd.get_data(
    universe=['A.N', 'VOD.L', '0R0Yl.TRE^K19', 'BDX'],
    fields=['TR.GHGEmissionMethod', 'TR.GHGEmissionMethod.esgvalueitemcode', 'TR.GHGEmissionMethod.esgsourceurl'],
    parameters={'SDate': '0', 'EDate': '-9', 'Period': 'FY0', 'Frq': 'FY'})


or this:


rd.get_history(
    universe=['A.N', 'VOD.L', '0R0Yl.TRE^K19', 'BDX'],
    fields=['TR.GHGEmissionMethod',
            'TR.GHGEmissionMethod.esgvalueitemcode',
            'TR.GHGEmissionMethod.esgsourceurl',
            'TR.GHGEmissionMethod.instrument',
            'TR.GHGEmissionMethod.esgsourcetitle',
            'TR.GHGEmissionMethod.esgvalueitemcode'],
    start='2010-01-01',
    end='2023-01-01')
icon clock
10 |1500

Up to 2 attachments (including images) can be used with a maximum of 512.0 KiB each and 1.0 MiB total.


E.g.: (I couldn't add these on the main answer)


1712136649977.png

1712136649977.png (443.0 KiB)

continued:


1712137711557.png

1712137028028.png


1712137711557.png (179.2 KiB)
1712137028028.png (78.6 KiB)
Upvotes
5.8k 21 2 6

Hi @avinash.sonde ,

Have you had a look as `Datastream` in the Developer portal's search bar? This is what it outputs. Looking at this resulted list, I found the following, all of which I think can help in providing code samples to go through the steps you are outlining:


> Forecasting Inflation: Romanian Case Study Using SARIMA Models

> Datastream API (DSWS) Median Index Data

> How to Collect Datastream IBES Global Aggregate Earnings Data with Python and CodeBook - Part 1

> Forecasting Inflation: Romanian Case Study Using SARIMA Models


If the above are not sufficient, please do let me know.

icon clock
10 |1500

Up to 2 attachments (including images) can be used with a maximum of 512.0 KiB each and 1.0 MiB total.

Upvotes
1 0 0 0

Hello @jonathan.legrand

Below is the client's reply after sharing the links provided above.

"They are unfortunately not helpful. I did try to figure out, however it did not help to solve my problem. Is it nobody that can answer my specific question about scope 1 and scope 2?"

icon clock
10 |1500

Up to 2 attachments (including images) can be used with a maximum of 512.0 KiB each and 1.0 MiB total.

Write an Answer

Hint: Notify or tag a user in this post by typing @username.

Up to 2 attachments (including images) can be used with a maximum of 512.0 KiB each and 1.0 MiB total.