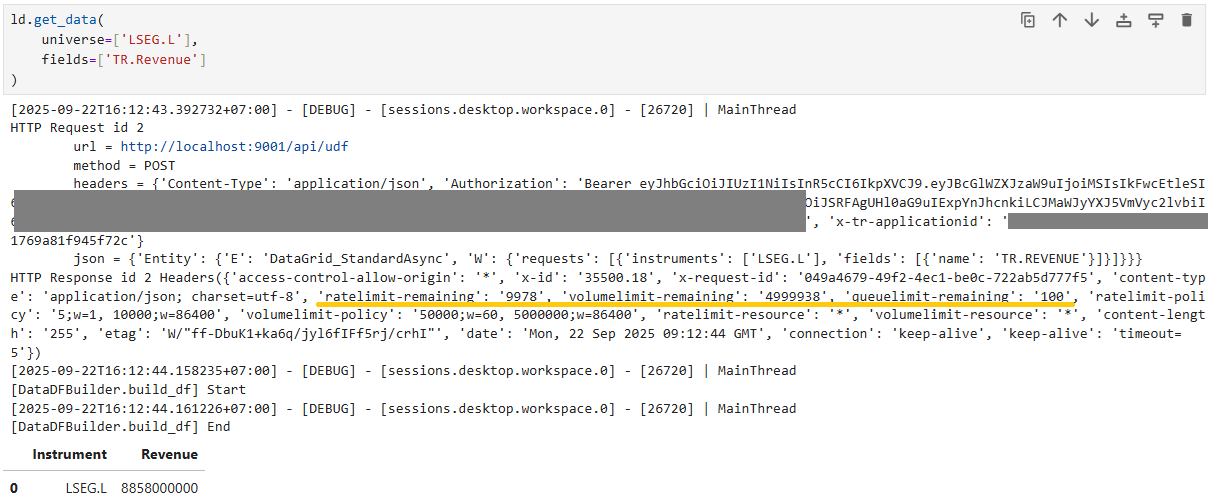
Where can I check how much data I have extracted using API calls for the day so as to prevent myself from hitting the daily limit?
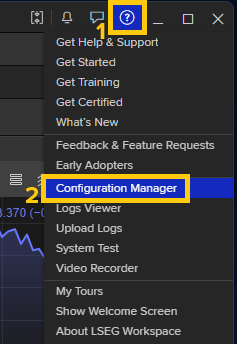
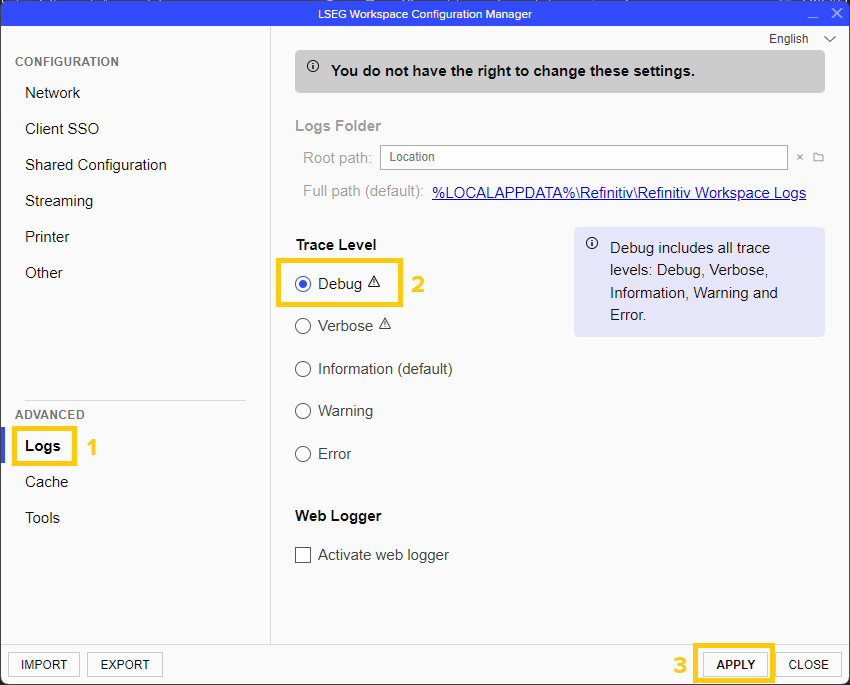
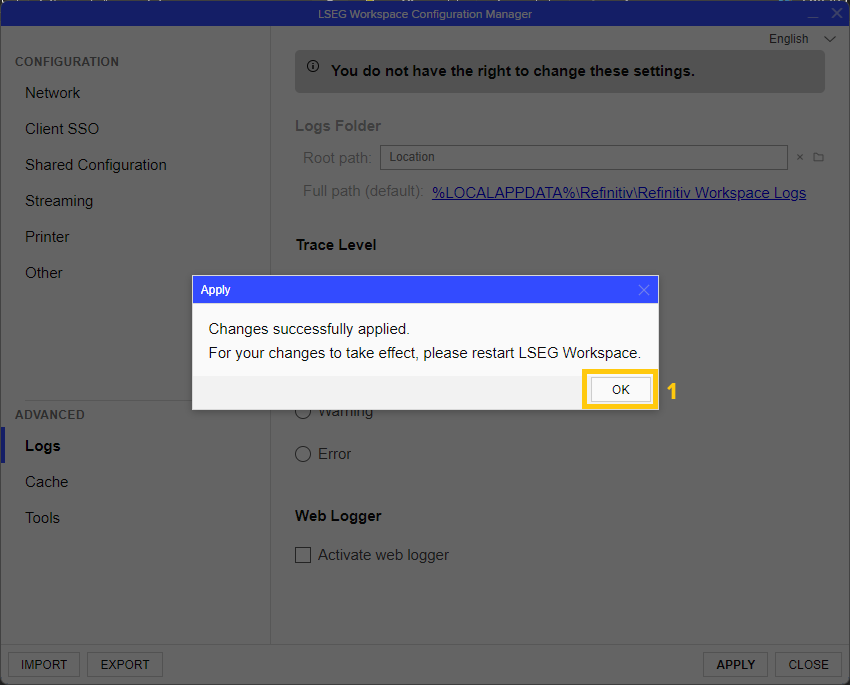
I have been checking the Logs from the Configuration Manager and in the log text file I get the information of my usage. Can you please let me know how frequent do the logs get updated in the log file because they do not seem to be updated dynamically on a quick real time basis?
Also, I would like to know if there is a better approach to find the amount of usage of data I have done and/or the number of API calls.
So, there is no direct way possible to get the data usage limit alert. I would like to know how frequent the logs are updated in the configuration file so that I can look into it. Can you please help me with this?
(Raising it on behalf of external client)