Upgrade from Eikon -> Workspace. Learn about programming differences.

For a deeper look into our Eikon Data API, look into:

Overview |  Quickstart |  Documentation |  Downloads |  Tutorials |  Articles

question

Upvotes
Accepted
1 1 2 4

retrieve historical data with get_timeseries for JCI.N

I am trying to retrieve historical data from EIKON python data API.

with bellowing code:

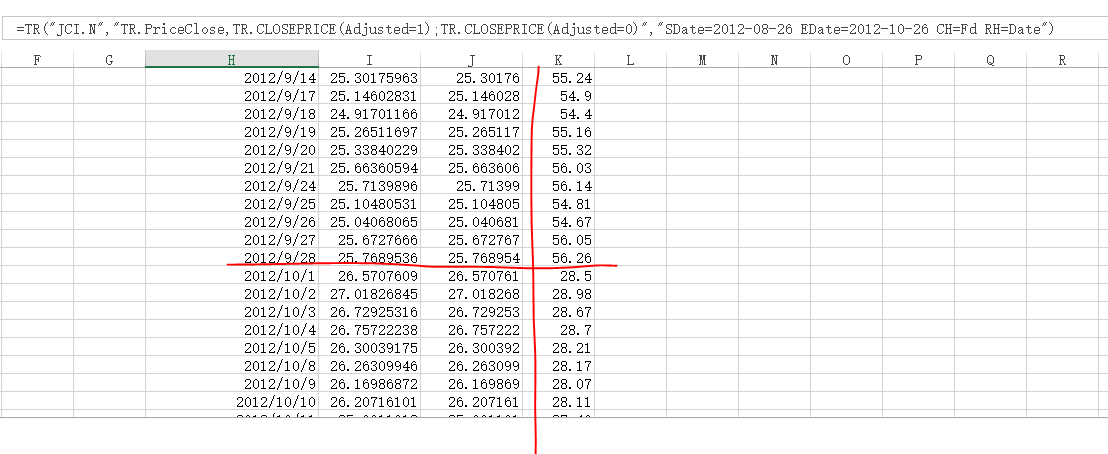
ek.get_timeseries('JCI.N', fields='*', interval='daily', start_date="2010-0-04", end_date="2018-10-20", corax='unadjusted')

with the comparison of Yahoo Finance and investopedia. it sounds the get_timeseries returned the "Adjusted" price before Oct.1, 2012.

Could someone throw some lights here?

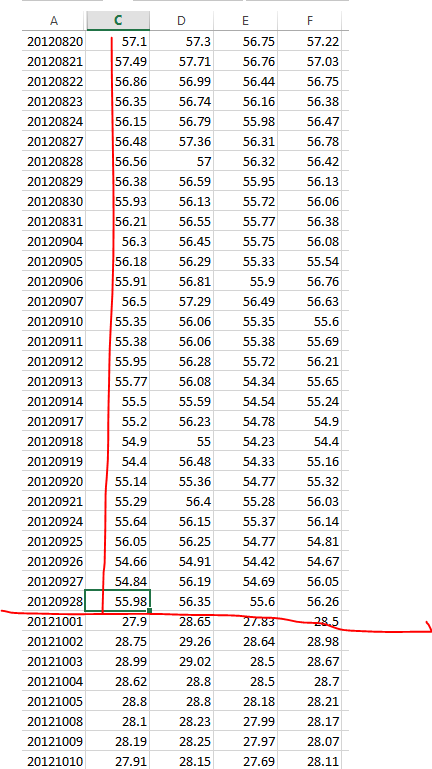
EIKON: all price above $50 before Oct.1, 2012.
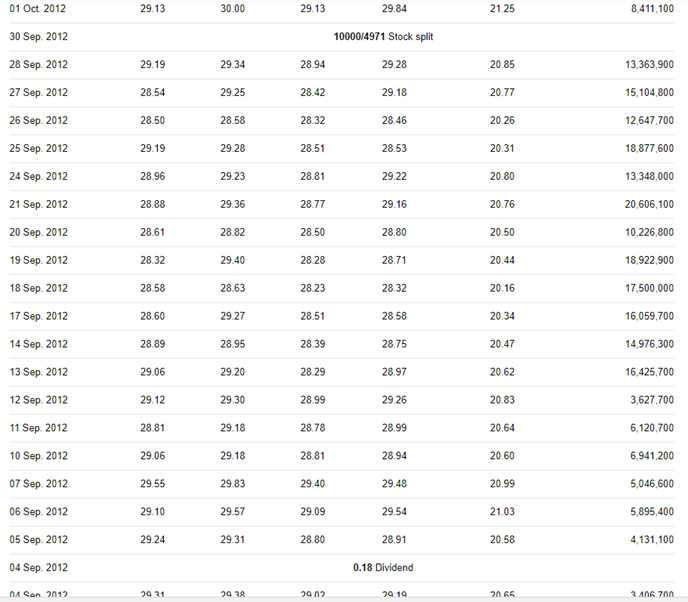
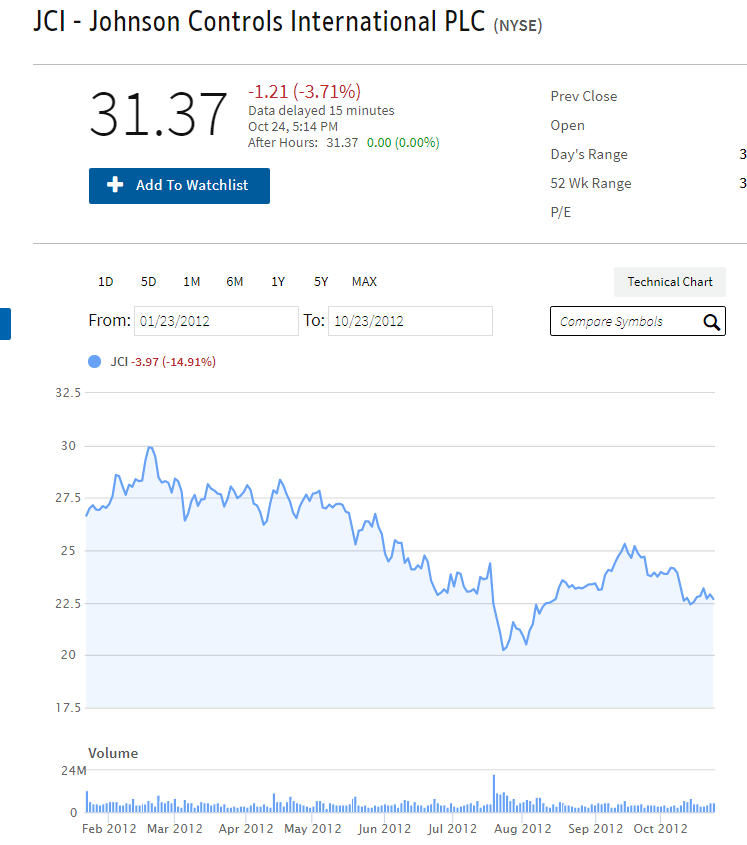
Yahoo finance

eikoneikon-data-apipythonrefinitiv-dataplatform-eikonworkspaceworkspace-data-apihistorical
icon clock
10 |1500

Up to 2 attachments (including images) can be used with a maximum of 512.0 KiB each and 1.0 MiB total.

@guogl

Thank you for your participation in the forum.

Is the reply below satisfactory in resolving your query?

If yes, please click the 'Accept' text next to the reply. This will guide all community members who have a similar question. Otherwise please post again offering further insight into your question.

Thanks,

AHS

Upvote
Accepted
39.4k 77 11 27

I'm not sure what you mean when you say "EIKON: all price above $50 before Oct.1, 2010".
As far as I can see the unadjusted close price returned by get_timeseries method for say 2010-09-30 is $36.73.
This said there's something rather peculiar about adjusted price history for this stock. Different vendors return rather different values. E.g. for 2012-10-26 Investopedia returns $22.37, Yahoo! Finance - $28.14, Eikon - $25.0511 ($26.87 unadjusted), NYSE Website - $25.1798.
I'm not sure why there's such a considerable variation between vendors or which price is right. What I can tell is that this content issue has nothing to do with the API, and this forum is not the best resource to provide content explanation. You may want to contact Refinitiv Helpdesk by either calling the Helpdesk number in your country or by using Contact Us capability in your Eikon application. A content specialist on the Helpdesk should be able to explain how Refinitiv arrived at $25.0511, why it's different from $25.1798 NYSE Web site shows, and correct the price history in Eikon if he or she determines it needs correcting. We may not be able to explain why Yahoo! and Investopedia show different prices.
The price history can be easily retrieved using Eikon Excel and I suggest you use Excel formulas to provide examples when contacting Refnitiv Helpdesk, e.g both adjusted and unadjusted price for 2012-10-26 is returned using
=TR("JCI.N","TR.CLOSEPRICE(Adjusted=1);TR.CLOSEPRICE(Adjusted=0)","SDate=2012-10-26 CH=Fd RH=Date")

icon clock
10 |1500

Up to 2 attachments (including images) can be used with a maximum of 512.0 KiB each and 1.0 MiB total.

Upvotes
1 1 2 4

investopedia


icon clock
10 |1500

Up to 2 attachments (including images) can be used with a maximum of 512.0 KiB each and 1.0 MiB total.

Upvotes
1 1 2 4

@Alex Putkov

thanks for response and apologize the typo in my post.

Actually I mean all price above $50 before Oct.1, 2012.

understood there are minor difference on price between vendors, but for unadjusted price, the gap sounds big between $50 and $30.

Agreed it is regarding the content rather than API.

I will try the luck with help desk.


jci-2012-10-01.png (33.9 KiB)
icon clock
10 |1500

Up to 2 attachments (including images) can be used with a maximum of 512.0 KiB each and 1.0 MiB total.

Upvotes
39.4k 77 11 27

I'm not sure I'm following. Big jumps in price due to capital change events is exactly what one should expect from unadjusted price. The whole point of adjusting price history for capital change events is to work around these big jumps and smooth the price history by removing the effect of capital change events.
Oct 1st 2012 is the ex. date for a demerger resulting in the stock price adjusted by a factor of 0.49129. The drop from ~$56 to ~$28 in unadjusted price between Sep 28th 2012 and Oct 1st 2012 is exactly what I would expect as a result of this demerger.

icon clock
10 |1500

Up to 2 attachments (including images) can be used with a maximum of 512.0 KiB each and 1.0 MiB total.

Write an Answer

Hint: Notify or tag a user in this post by typing @username.

Up to 2 attachments (including images) can be used with a maximum of 512.0 KiB each and 1.0 MiB total.