Upgrade from Eikon -> Workspace. Learn about programming differences.

For a deeper look into our Eikon Data API, look into:

Overview |  Quickstart |  Documentation |  Downloads |  Tutorials |  Articles

question

Upvotes
Accepted
3 0 1 1

5 year range EIA Crude Cushing Chart - Eikon Python Pull

Hi Everyone,

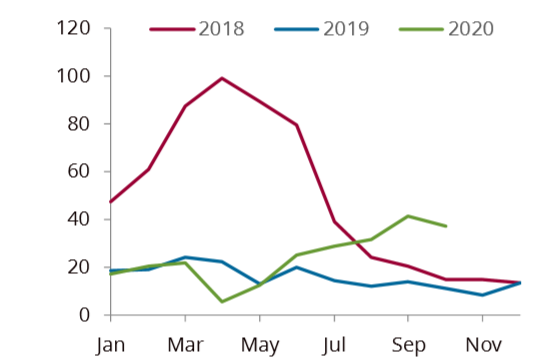
I'm attempting to pull some EIA data to generate a chart that shows the 5 year range of EIA Crude Stock Levels at Cushing. I tried figuring it out on my own, but the examples on github were overwhelming. Could someone please help me with how to generate a basic python script for how to create a chart like this? I'm looking for something that would show the last 5 years of data, all on one chart.

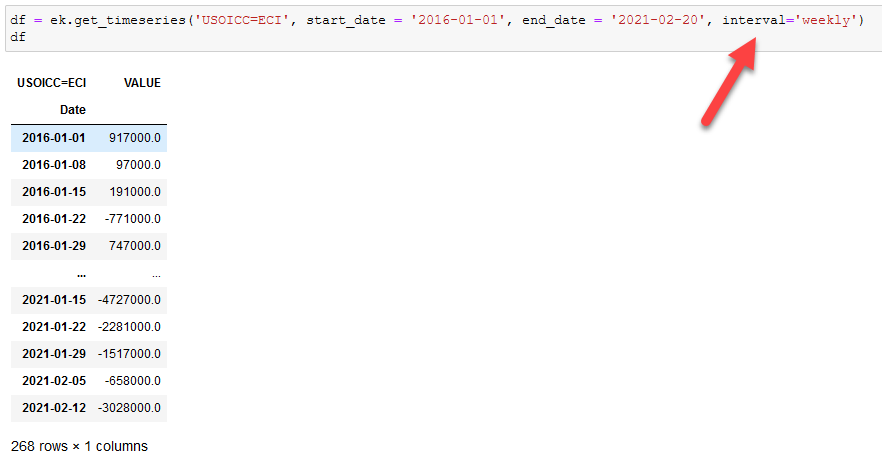
To start, I was writing some python to try to find the basic time series. I saw the Reuters code for this information as USOICC=ECI, however, this script didn't work (I put in my API key properly, and it worked for basic futures quotes like WTI already)


Thanks so much for your help!

Peter

import eikon as ek
ek.set_app_key('XXXXXXX')
df = ek.get_timeseries(['USOICC=ECI'], 
                       start_date="2016-01-01",
                       end_date="2020-12-31",
                       )
df
eikoneikon-data-apipythonrefinitiv-dataplatform-eikonworkspaceworkspace-data-api
1614012802758.png (37.9 KiB)
icon clock
10 |1500

Up to 2 attachments (including images) can be used with a maximum of 512.0 KiB each and 1.0 MiB total.

1 Answer

· Write an Answer
Upvotes
Accepted
18.2k 21 13 21

Hi @pwares

To make the API call work, you have to add interval='weekly'


Then you can plot the data from the "df" variable.

df.plot()

ahs1.png (21.7 KiB)
icon clock
10 |1500

Up to 2 attachments (including images) can be used with a maximum of 512.0 KiB each and 1.0 MiB total.

Write an Answer

Hint: Notify or tag a user in this post by typing @username.

Up to 2 attachments (including images) can be used with a maximum of 512.0 KiB each and 1.0 MiB total.