Upgrade from Eikon -> Workspace. Learn about programming differences.

For a deeper look into our Eikon Data API, look into:

Overview |  Quickstart |  Documentation |  Downloads |  Tutorials |  Articles

question

Upvotes
Accepted
49 4 6 8

How could I transpose the table (Python Eikon Data API)?

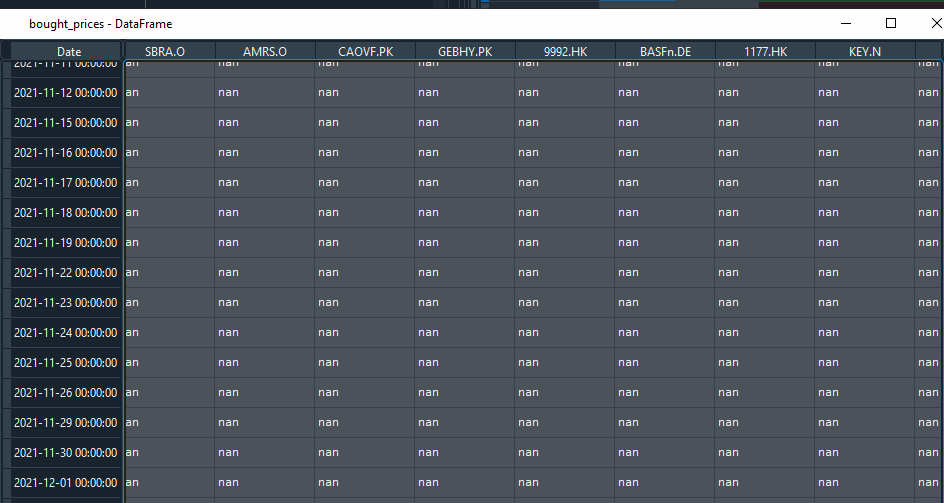
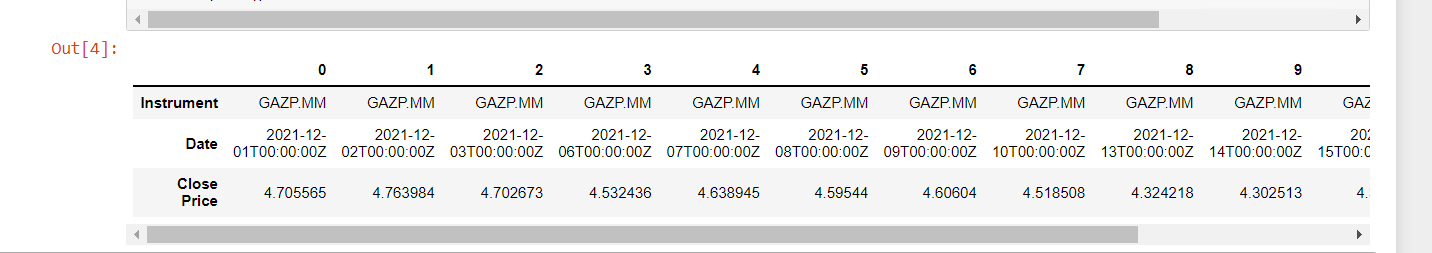
The following code shows RICs in a column whereas I want to have RICs in a row (first row).

import eikon as ek


ek.set_app_key('')


df, err = ek.get_data(

instruments = ['GAZP.MM', 'SBER.MM'],

fields = ['TR.CLOSEPRICE(Frq=D,SDate=2021-12-01,EDate=2021-12-19,Curn=USD).date','TR.CLOSEPRICE(Frq=D,SDate=2021-12-01,EDate=2021-12-19,Curn=USD)' ]

)


display(df)


eikon-data-apipython
icon clock
10 |1500

Up to 2 attachments (including images) can be used with a maximum of 512.0 KiB each and 1.0 MiB total.

hi @susskaya.anita

Thank you for your participation in the forum. Is the reply below satisfactory in resolving your query?

If so please can you click the 'Accept' text next to the appropriate reply? This will guide all community members who have a similar question.

Thanks,
AHS

Please be informed that a reply has been verified as correct in answering the question, and has been marked as such.

Thanks,
AHS

Upvotes
Accepted
32.2k 40 11 20

Hello @susskaya.anita ,

Try this:

df.pivot(index = 'Date', columns = 'Instrument', values ='Close Price')

Results with your request look like this from my testing:

pivot.gif


pivot.gif (27.3 KiB)
icon clock
10 |1500

Up to 2 attachments (including images) can be used with a maximum of 512.0 KiB each and 1.0 MiB total.

Upvotes
32.2k 40 11 20
icon clock
10 |1500

Up to 2 attachments (including images) can be used with a maximum of 512.0 KiB each and 1.0 MiB total.

Thanks for your answer, but I would like to have something like this:

1640077162232.png

and not this:

1640077197978.png

In excel via Formula Builder we could do that easily.

1640077162232.png (22.6 KiB)
1640077197978.png (18.6 KiB)
Upvotes
20 0 1 6

Hello, how can I transpose the table for below script where the RICs are in rows while Dates/Values are in Columns?


I tried df.pivot(index = 'Instrument', columns = 'Date', values ='Close Price') ;

I also tried display(df.transpose) and both did not work.


import refinitiv.data as rd

rd.open_session()


df = rd.get_history(

universe=["EURNZDFIXM=WM", "USDEURFIXM=WM", "EURCADFIXM=WM", "EURGBPFIXM=WM", "EURJPYFIXM=WM", "EURNOKFIXM=WM", "EURSEKFIXM=WM", "EURDKKFIXM=WM", "EURCHFFIXM=WM", "EURHKDFIXM=WM", "EURAUDFIXM=WM", "EURSGDFIXM=WM", "EURZARFIXM=WM", "EURTOFFIXM=WM", "EURIDRFIXM=WM"],

fields=["TR.MIDPRICE"],

interval="1M",

start="2022-12-30",

end="2022-12-30"

)


icon clock
10 |1500

Up to 2 attachments (including images) can be used with a maximum of 512.0 KiB each and 1.0 MiB total.

Write an Answer

Hint: Notify or tag a user in this post by typing @username.

Up to 2 attachments (including images) can be used with a maximum of 512.0 KiB each and 1.0 MiB total.