Upgrade from Eikon -> Workspace. Learn about programming differences.

For a deeper look into our Eikon Data API, look into:

Overview |  Quickstart |  Documentation |  Downloads |  Tutorials |  Articles

question

Upvotes
Accepted
23 3 3 3

Gap in FX data via Eikon API

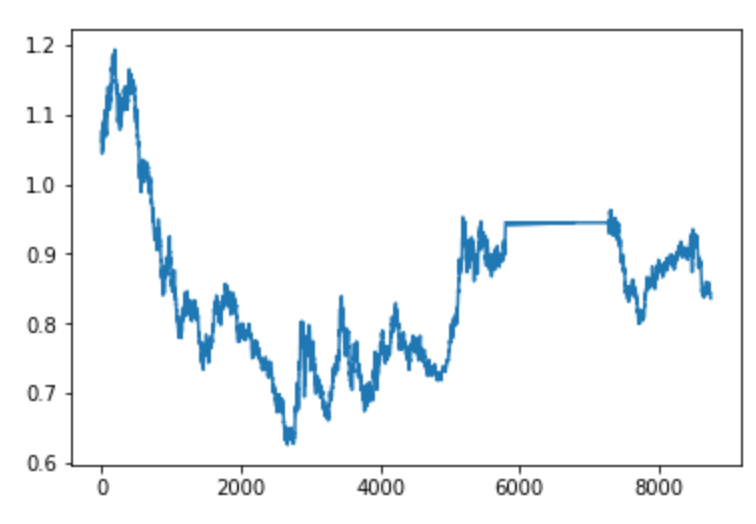
When I run this query:

df, err = ek.get_data(["EUR=", "USD="],["TR.FxRateComposite.date","TR.FxRateComposite"], {'SDate':'2000-01-01', 'EDate':'2020-12-01'})

I notice that there are roughly two years (approx. 2015-2016) of FX data that seems to be wrong. Picture attached. I've tried this with 10+ currencies with the same result. Does anyone know why this is the case?

eikoneikon-data-apipythonrefinitiv-dataplatform-eikonworkspaceworkspace-data-apiforex
icon clock
10 |1500

Up to 2 attachments (including images) can be used with a maximum of 512.0 KiB each and 1.0 MiB total.

Upvotes
Accepted
23 3 3 3

Thank you @zoya.farberov for the tip. The gap is not present if I don't request "USD" since the query returns less than 10k data points. Thank you for your help!

icon clock
10 |1500

Up to 2 attachments (including images) can be used with a maximum of 512.0 KiB each and 1.0 MiB total.

Upvote
39.4k 77 11 27

I'm afraid I'm not reproducing this on my end. On my end

df, err = ek.get_data(["EUR="],
                      ["TR.FxRateComposite.date","TR.FxRateComposite"], 
                      {'SDate':'2000-01-01', 'EDate':'2020-12-01'})
df.plot.line(y='FX Rate Last')

produces

One thing I notice is that the number of rows in the dataframe you plot is >8K, whereas the dataframe returned by my code above contains <8K rows. Could you check how you get the rows corresponding to the flat line in your plot? Are they returned by get_data method? If yes, would you mind including the exact get_data call that returns the dataframe with suspect data and export the values in the dataframe to a CSV file, zip it and attach it to your post?


eur.png (16.0 KiB)
icon clock
10 |1500

Up to 2 attachments (including images) can be used with a maximum of 512.0 KiB each and 1.0 MiB total.

Upvote
32.2k 40 11 20

Hello @christoph.b,

I do not reproduce this on my side.

I can think of two possible causes, one is you may be hitting around 10K datapoints limit. See Eikon Data API Usage and Limits Guideline for more detailed info on this.

Suggest removing USD=, it does not seem to yield value, as is always 1.0

See if this helps.

The other, something may be off with charting, I do not see dates, try this:

See if it helps?


eurcont.gif (35.7 KiB)
eurchart.gif (112.6 KiB)
icon clock
10 |1500

Up to 2 attachments (including images) can be used with a maximum of 512.0 KiB each and 1.0 MiB total.

Write an Answer

Hint: Notify or tag a user in this post by typing @username.

Up to 2 attachments (including images) can be used with a maximum of 512.0 KiB each and 1.0 MiB total.