Python code for 3K ISIN

What I want is to download the data for 3K ISINs. That can be done using Python.if I use python I don't get auto-imputed data.
Below is the Python code client is refering
import refinitiv.data as rdfrom tqdm import tqdmfor isin in tqdm(isins):try:response = rd.get_history(universe=[isin.strip()],fields=["TR.DividendYield","TR.F.ComStockBuybackNet","TR.NumberofSharesOutstandingActual","TR.NetDebtToEBITDA","TR.FreeCashFlow","TR.SharesOutstanding","TR.F.PriceToCFPerShr","TR.PCReturnOnInvestedCapPct","TR.WACC","TR.CompanyMarketCap","AVAIL(TR.F.IntrCovRatioTTM(AlignType=PeriodEndDate),TR.F.IntrCovRatio(AlignType=PeriodEndDate, Period=FY0))","AVAIL(TR.DPSMean( AlignType=PeriodEndDate, Methodology=InterimSum, Period=NTM),TR.DPSMean(AlignType=PeriodEndDate, Methodology=WeightedAnnual, Period=NTM))","TR.F.DPSComGrossIssue5YrCAGR(AlignType=PeriodEndDate, InstrumentType=Primary)","AVAIL(TR.F.EVToLeveredFOCFTTM(AlignType=PeriodEndDate),TR.F.EVToLeveredFOCF(AlignType=PeriodEndDate, Period=FY0))","AVAIL(TR.F.FOCFYldPctTTM(AlignType=PeriodEndDate),TR.F.FOCFYldPct(AlignType=PeriodEndDate, Period=FY0))","TR.FreeFloatPct","TR.Volume",],start="2015-05-29",end="2025-06-03",interval = "monthly")response.to_csv(f"historic_data/historic_refinitv_data_{isin}.csv")except Exception as ex:print(ex)with open("historic_data/errores.csv", "a") as file:file.write(f"{isin}\n")
Answers
-
Please see the Data Limits guideline document on the dev portal, and implement the recommendations.
You can also see the example usage of get_history API call in the code samples. The fields being used are for get_data and not available for historical data.
0 -
@Gurpreet Client has follow up
I believe there seems to be a misunderstanding. We aim to obtain 10 years of 19 characteristics from 3,000 companies (some of which we know support historical series and some do not):
- Supports historical series:
- "TR.DividendYield"
- "TR.F.ComStockBuybackNet"
- "TR.NumberofSharesOutstandingActual"
- "TR.NetDebtToEBITDA"
- "TR.FreeCashFlow"
- "TR.SharesOutstanding"
- "TR.F.PriceToCFPerShr"
- "TR.PCReturnOnInvestedCapPct"
- "TR.WACC"
- "TR.CompanyMarketCap"
- "AVAIL(TR.F.IntrCovRatioTTM(AlignType=PeriodEndDate),TR.F.IntrCovRatio(AlignType=PeriodEndDate, Period=FY0))"
- "AVAIL(TR.DPSMean(AlignType=PeriodEndDate, Methodology=InterimSum, Period=NTM),TR.DPSMean(AlignType=PeriodEndDate, Methodology=WeightedAnnual, Period=NTM))"
- "TR.F.DPSComGrossIssue5YrCAGR(AlignType=PeriodEndDate, InstrumentType=Primary)"
- "AVAIL(TR.F.EVToLeveredFOCFTTM(AlignType=PeriodEndDate),TR.F.EVToLeveredFOCF(AlignType=PeriodEndDate, Period=FY0))"
- "AVAIL(TR.F.FOCFYldPctTTM(AlignType=PeriodEndDate),TR.F.FOCFYldPct(AlignType=PeriodEndDate, Period=FY0))"
- "TR.FreeFloatPct"
- "TR.Volume"
- Does not support historical series:
- "TR.HQCountryCode"
- "TR.GICSSector"
We have two methods to mass obtain this data:
Using Excel:
=@RDP .Data($B$7:$B$40;D$1:V$1;"Sdate=#1 EDate=#2 Frq=CM Curn:USD RH:Calcdate Null=BLANK CH:FD,IN";C2;$B$4;$B$5)
Using Python:
import refinitiv.data as rd
from tqdm import tqdm
for isin in tqdm(isins):
try:
response = rd.get_history(
universe=[isin.strip()],
fields=[
"TR.DividendYield",
"TR.F.ComStockBuybackNet",
"TR.NumberofSharesOutstandingActual",
"TR.NetDebtToEBITDA",
"TR.FreeCashFlow",
"TR.SharesOutstanding",
"TR.F.PriceToCFPerShr",
"TR.PCReturnOnInvestedCapPct",
"TR.WACC",
"TR.CompanyMarketCap",
"AVAIL(TR.F.IntrCovRatioTTM(AlignType=PeriodEndDate),TR.F.IntrCovRatio(AlignType=PeriodEndDate, Period=FY0))",
"AVAIL(TR.DPSMean( AlignType=PeriodEndDate, Methodology=InterimSum, Period=NTM),TR.DPSMean(AlignType=PeriodEndDate, Methodology=WeightedAnnual, Period=NTM))",
"TR.F.DPSComGrossIssue5YrCAGR(AlignType=PeriodEndDate, InstrumentType=Primary)",
"AVAIL(TR.F.EVToLeveredFOCFTTM(AlignType=PeriodEndDate),TR.F.EVToLeveredFOCF(AlignType=PeriodEndDate, Period=FY0))",
"AVAIL(TR.F.FOCFYldPctTTM(AlignType=PeriodEndDate),TR.F.FOCFYldPct(AlignType=PeriodEndDate, Period=FY0))",
"TR.FreeFloatPct",
"TR.Volume",
],
start="2015-05-29",
end="2025-06-03",
interval="monthly"
)
response.to_csv(f"historic_data/historic_refinitv_data_{isin}.csv")
except Exception as ex:
print(ex)
with open("historic_data/errores.csv", "a") as file:
file.write(f"{isin}\n")
Client
- A way to download the data using Python with auto-imputing of the data as done in Excel.
0 - Supports historical series:
-
What does the client mean by "auto-imputing of the data"?
Python doesn't support the RH, Null, and CH parameter used in Excel.
RH:Calcdate Null=BLANK CH:FD,IN
The library returns a pandas dataframe. Typically, the client can use the dataframe's functions to manipulate the dataframe.
0 -
Hi @Jirapongse ,
Thank you for clarifying the use of parameters in Excel and Python. The formula we are using in Excel, as your colleague mentioned earlier, is the following:
=@RDP .Data($B$7:$B$40;D$1:V$1;"Sdate=#1 EDate=#2 Frq=CM Curn:USD RH:Calcdate Null=BLANK CH:FD,IN";C2;$B$4;$B$5)
The code we use in Python is as follows:
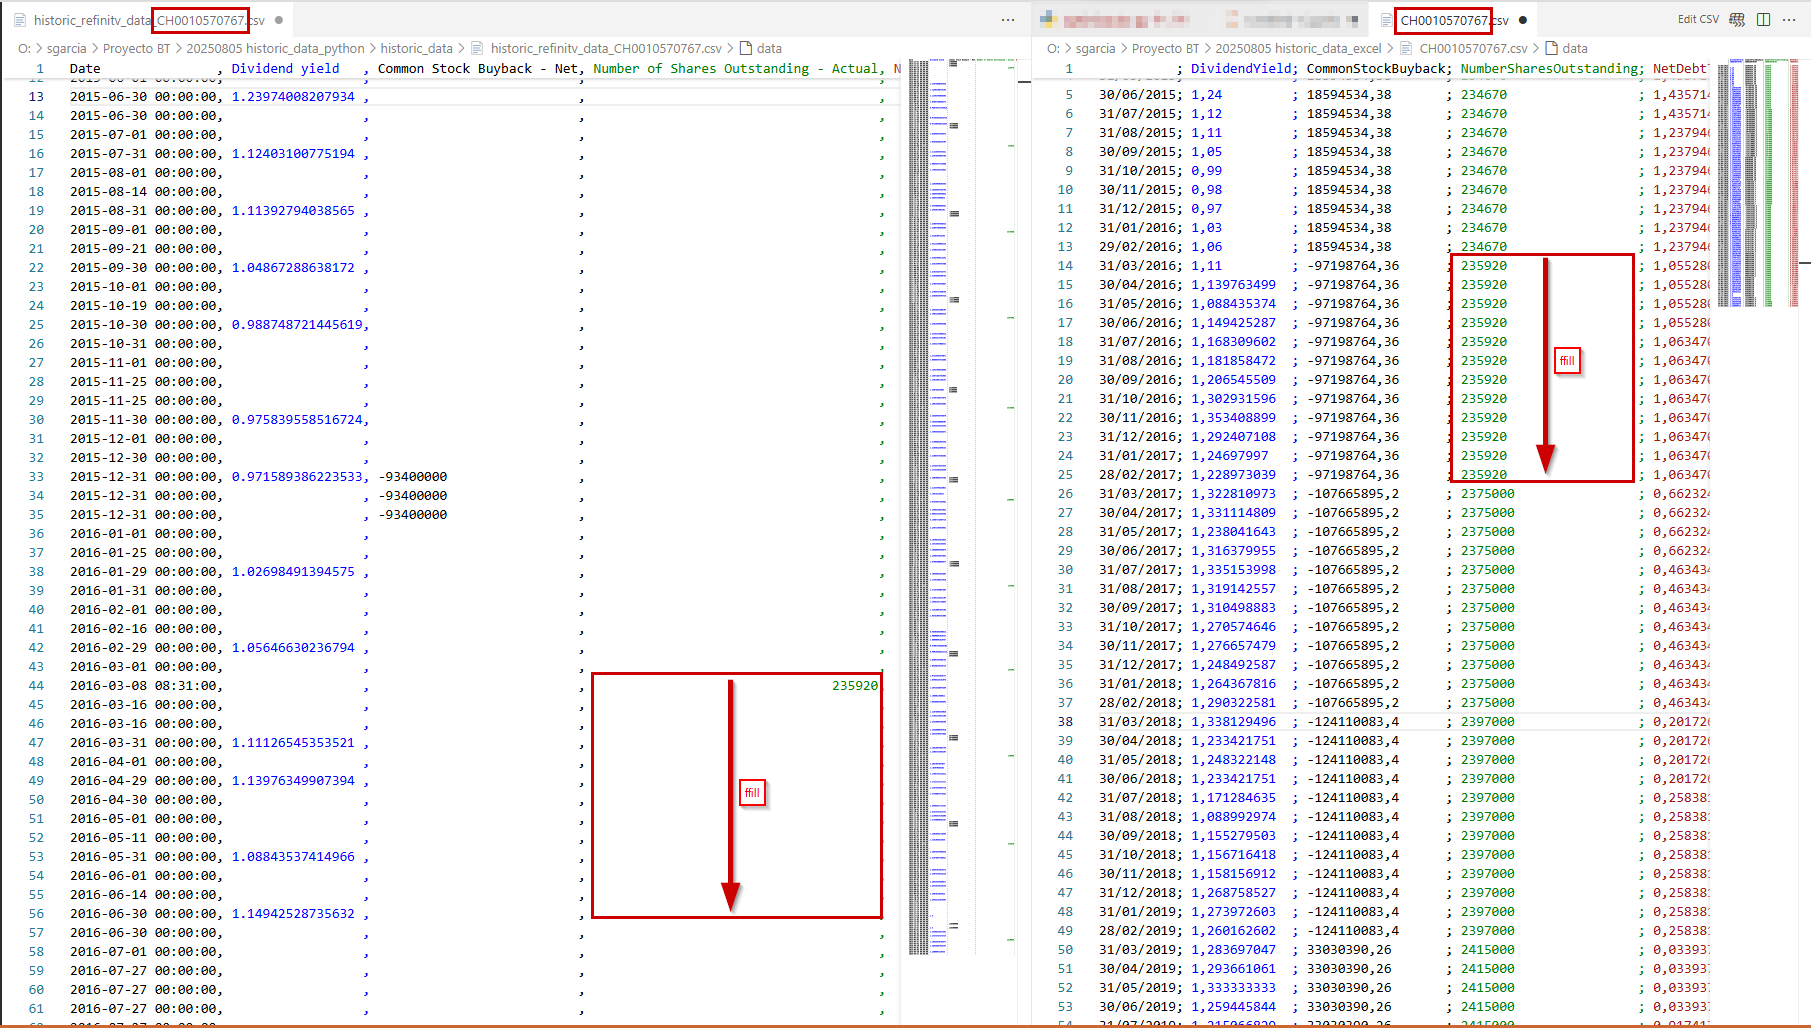
import refinitiv.data as rdfrom tqdm import tqdmfor isin in tqdm(isins): try: response = rd.get_history( universe=[isin.strip()], fields=[ "TR.DividendYield", "TR.F.ComStockBuybackNet", "TR.NumberofSharesOutstandingActual", "TR.NetDebtToEBITDA", "TR.FreeCashFlow", "TR.SharesOutstanding", "TR.F.PriceToCFPerShr", "TR.PCReturnOnInvestedCapPct", "TR.WACC", "TR.CompanyMarketCap", "AVAIL(TR.F.IntrCovRatioTTM(AlignType=PeriodEndDate),TR.F.IntrCovRatio(AlignType=PeriodEndDate, Period=FY0))", "AVAIL(TR.DPSMean( AlignType=PeriodEndDate, Methodology=InterimSum, Period=NTM),TR.DPSMean(AlignType=PeriodEndDate, Methodology=WeightedAnnual, Period=NTM))", "TR.F.DPSComGrossIssue5YrCAGR(AlignType=PeriodEndDate, InstrumentType=Primary)", "AVAIL(TR.F.EVToLeveredFOCFTTM(AlignType=PeriodEndDate),TR.F.EVToLeveredFOCF(AlignType=PeriodEndDate, Period=FY0))", "AVAIL(TR.F.FOCFYldPctTTM(AlignType=PeriodEndDate),TR.F.FOCFYldPct(AlignType=PeriodEndDate, Period=FY0))", "TR.FreeFloatPct", "TR.Volume", ], start="2015-05-29", end="2025-06-03", interval="monthly" ) response.to_csv(f"historic_data/historic_refinitv_data_{isin}.csv") except Exception as ex: print(ex) with open("historic_data/errores.csv", "a") as file: file.write(f"{isin}\n")For example, in the case of ISIN CH0010570767 (please refer to the image below, Python on the left side and Excel on the right side), we obtain the following result and, setting aside the discrepancy in the data (which we are resolving separately), the behavior of both extraction methods differs:
- Indexes (dates) differ as you can see.
- Excel auto-imputes missing values (for “NumberofSharesOutstandingActual” it uses forward-fill method), but Python does not, it leaves the blanks.
So we have to handle the missing data ourselves or provide an unknown (if it exists) parameter to the function `get_history`, we rather use this last option.
Our goal is to obtain every company's data (3k companies by 19 features) for a 10 year period with the missing-values already filled using Python.
Best regards,
Pedro Ventura0 -
The client should use the rd.get_data method instead of rd.get_history. For example:
response = rd.get_data(
            universe=['CH0010570767'],
            fields=[
                "TR.DividendYield.Calcdate",
                "TR.DividendYield",
                "TR.F.ComStockBuybackNet",
                "TR.NumberofSharesOutstandingActual",
                "TR.NetDebtToEBITDA",
                "TR.FreeCashFlow",
                "TR.SharesOutstanding",
                "TR.F.PriceToCFPerShr",
                "TR.PCReturnOnInvestedCapPct",
                "TR.WACC",
                "TR.CompanyMarketCap",
                "AVAIL(TR.F.IntrCovRatioTTM(AlignType=PeriodEndDate),TR.F.IntrCovRatio(AlignType=PeriodEndDate, Period=FY0))",
                "AVAIL(TR.DPSMean( AlignType=PeriodEndDate, Methodology=InterimSum, Period=NTM),TR.DPSMean(AlignType=PeriodEndDate, Methodology=WeightedAnnual, Period=NTM))",
                "TR.F.DPSComGrossIssue5YrCAGR(AlignType=PeriodEndDate, InstrumentType=Primary)",
                "AVAIL(TR.F.EVToLeveredFOCFTTM(AlignType=PeriodEndDate),TR.F.EVToLeveredFOCF(AlignType=PeriodEndDate, Period=FY0))",
                "AVAIL(TR.F.FOCFYldPctTTM(AlignType=PeriodEndDate),TR.F.FOCFYldPct(AlignType=PeriodEndDate, Period=FY0))",
                "TR.FreeFloatPct",
                "TR.Volume",
            ],
            parameters={'SDate':'2015-05-29','EDate':'2025-06-03','Frq':'CM','Curn':'USD'}
        )
response
0 -
Hi @Jirapongse ,
This is exactly what we needed — thank you very much.Would you mind pointing me to the documentation where all the fields and their properties are listed? For instance, I wasn’t aware that
"TR.DividendYield"has a"Calcdate"property. Is this documented somewhere?Thanks again,
Pedro Ventura0 -
You can use the Formula Builder in the LSEG Workspace Excel or the Data Item Browser tool.
0


Categories
- All Categories
- 3 Polls
- 6 AHS
- 37 Alpha
- 167 App Studio
- 6 Block Chain
- 4 Bot Platform
- 18 Connected Risk APIs
- 47 Data Fusion
- 34 Data Model Discovery
- 713 Datastream
- 1.5K DSS
- 639 Eikon COM
- 5.3K Eikon Data APIs
- 20 Electronic Trading
- 1 Generic FIX
- 7 Local Bank Node API
- 12 Trading API
- 3K Elektron
- 1.5K EMA
- 260 ETA
- 574 WebSocket API
- 42 FX Venues
- 16 FX Market Data
- 2 FX Post Trade
- 1 FX Trading - Matching
- 12 FX Trading – RFQ Maker
- 5 Intelligent Tagging
- 2 Legal One
- 26 Messenger Bot
- 5 Messenger Side by Side
- 9 ONESOURCE
- 7 Indirect Tax
- 60 Open Calais
- 285 Open PermID
- 47 Entity Search
- 2 Org ID
- 1 PAM
- PAM - Logging
- 6 Product Insight
- Project Tracking
- ProView
- ProView Internal
- 25 RDMS
- 2.3K Refinitiv Data Platform
- 20 CFS Bulk File/TM3
- 939 Refinitiv Data Platform Libraries
- 6 LSEG Due Diligence
- 1 LSEG Due Diligence Portal API
- 4 Refinitiv Due Dilligence Centre
- Rose's Space
- 1.2K Screening
- 18 Qual-ID API
- 12 World-Check Customer Risk Screener
- World-Check On Demand
- 1K World-Check One
- 46 World-Check One Zero Footprint
- 46 Side by Side Integration API
- 2 Test Space
- 3 Thomson One Smart
- 10 TR Knowledge Graph
- 151 Transactions
- 143 REDI API
- 1.8K TREP APIs
- 4 CAT
- 27 DACS Station
- 126 Open DACS
- 1.1K RFA
- 108 UPA
- 197 TREP Infrastructure
- 232 TRKD
- 925 TRTH
- 5 Velocity Analytics
- 9 Wealth Management Web Services
- 107 Workspace SDK
- 11 Element Framework
- 5 Grid
- 19 World-Check Data File
- 1 Yield Book Analytics
- 48 中文论坛